
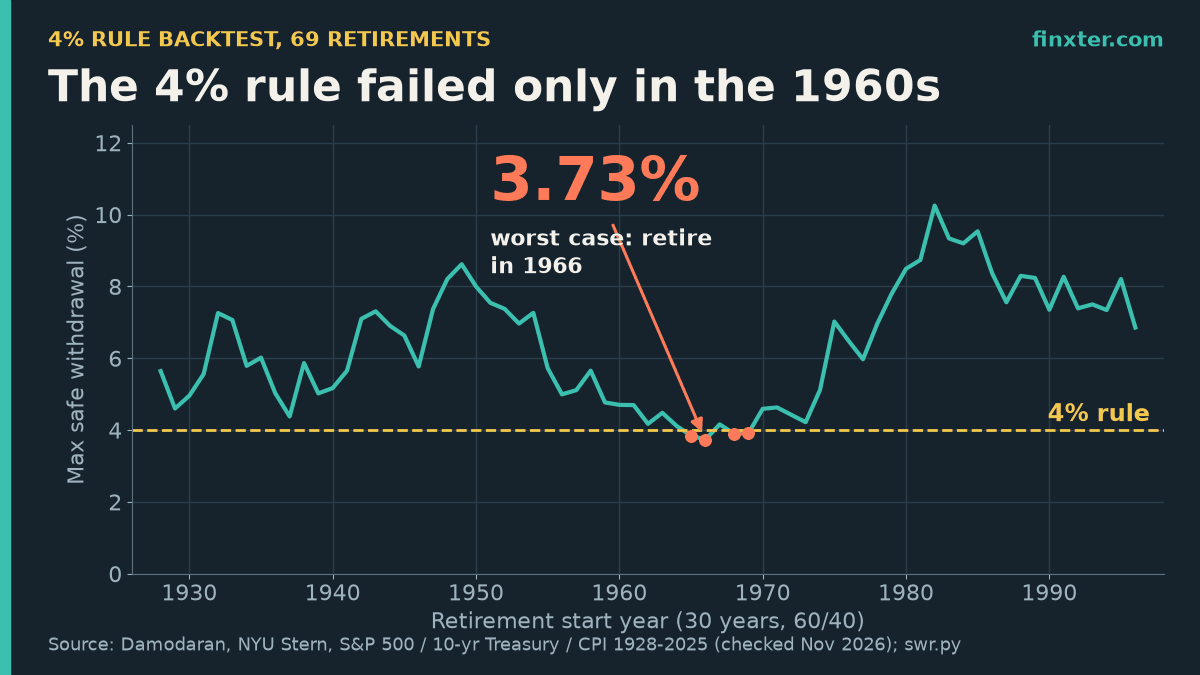
Most 4% rule calculators do one thing: multiply your spending by 25. Spend $40,000 a year, you need $1,000,000. That’s the rule’s arithmetic, not its test. The real question is whether the money would have lasted, so I replayed the rule on every 30-year US retirement that started between 1928 and 1996, using Aswath Damodaran’s annual S&P 500, 10-year Treasury and inflation data through 2025.
The 4% rule held in 65 of 69 retirements with a 60/40 portfolio. The four that failed all started in the mid-1960s, not in 1929. Below is a calculator that runs the same backtest on your own numbers, the full grid of withdrawal rates and stock shares, and a short Python script that reproduces it.
One lever most calculators skip: income that isn’t from the portfolio lowers the rate you need. Even a small catalog of self-published ebooks on Amazon KDP can do that. ImagineYourBook is an AI book-writing tool that turns a prompt or your notes into a 10,000-word text draft with a cover, exported as Word and EPUB, with series memory so Book Two remembers Book One. The royalty math is in the closing section.
TL;DR
- 4% with a 60/40 portfolio survived 65 of 69 US 30-year retirements (1928-1996 starts, data to 2025).
- All four failures started in 1965-1969, not 1929. Worst case: 1966, max safe rate 3.73%.
- At 60/40, 3.5% never failed at 30 years; 5% failed 28% of the time.
- Over 40 years, 4% survived 85%; over 50 years, 76% (60/40). A 1% fee cuts the 30-year rate from 94% to 86%.
- Interactive calculator and a short Python script included.
The 4% rule calculator (historical backtest)
Enter your portfolio, the yearly spending you need and any side income. The calculator converts that into a first-year withdrawal rate, raises the dollar amount with inflation every year, and checks every start year in the data. It runs in your browser.
4% rule calculator: backtest your numbers on every US retirement since 1928
Enable JavaScript to run the calculator. The static tables below show the same backtest.
Annual data 1928-2025: S&P 500 with dividends, 10-year US Treasury bond, CPI (Damodaran, NYU Stern). Withdrawals at the start of each year, raised by inflation, rebalanced yearly. Runs in your browser; nothing is sent anywhere.
How it works: you withdraw at the start of each year, the rest earns that year’s return, and the portfolio is rebalanced to your stock share every year. “Survived” means the balance never hit zero during the retirement. This is the method of William Bengen’s 1994 study and the later Trinity study, run on newer data (the Bogleheads wiki summarizes both).
What the 4% rule backtest shows: 65 of 69
Here is the default case: $1,000,000, $40,000 in year one, 60% S&P 500 and 40% 10-year Treasuries, 30 years.
| First-year withdrawal | On $1M | Multiple of spending | 30-yr success (60/40) | Worst outcome |
|---|---|---|---|---|
| 3.0% | $30,000 | 33.3x | 69/69 (100%) | none failed |
| 3.5% | $35,000 | 28.6x | 69/69 (100%) | none failed |
| 4.0% | $40,000 | 25x | 65/69 (94%) | 1966 ran out in year 26 |
| 4.5% | $45,000 | 22.2x | 58/69 (84%) | 11 start years failed |
| 5.0% | $50,000 | 20x | 50/69 (72%) | 19 start years failed |
| 6.0% | $60,000 | 16.7x | 36/69 (52%) | 33 start years failed |
- 4% survived 94% of the time (65 of 69). At 3.5%, every single start year survived. At 5%, only 72%.
- The failures were 1965, 1966, 1968 and 1969. The money ran out in year 26 to 28. The worst start, 1966, could have sustained at most 3.73% a year.
- Most retirees ended up richer. The median real balance after 30 years was $1,382,539, in today’s purchasing power. 43 of 69 ended above their starting $1M, and 27 ended with more than twice as much.
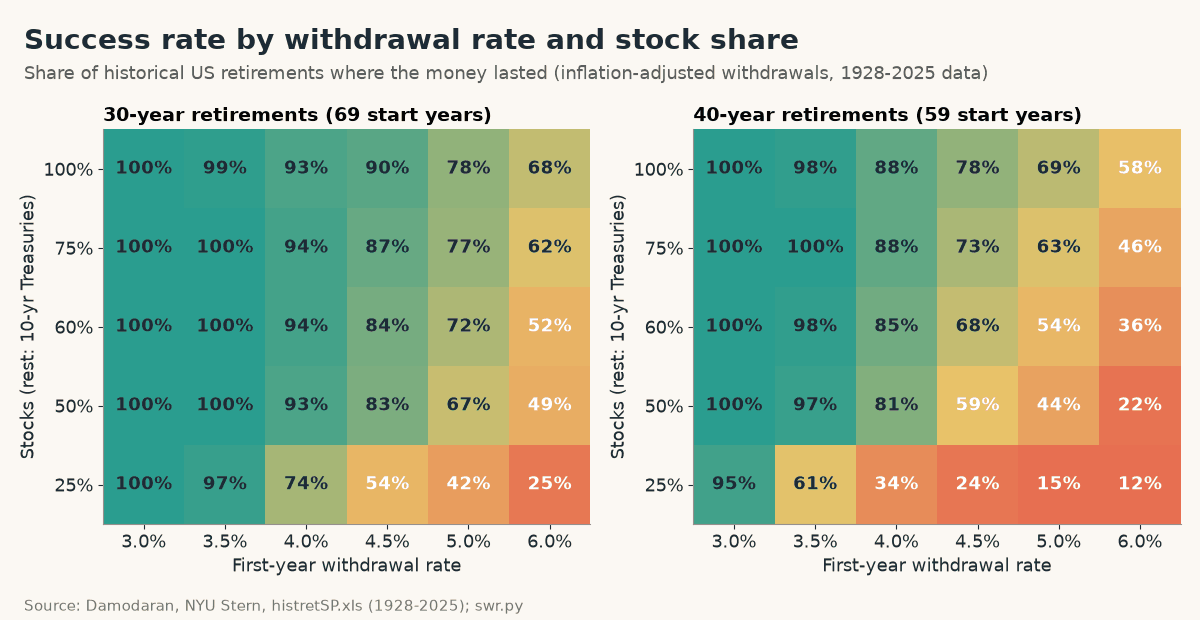
The grid shows the full picture for 30- and 40-year retirements. Two patterns stand out:
- More bonds didn’t make 4% safer. At 30 years, 75% and 60% stocks tied at 94%. Dropping to 25% stocks cut success to 74%, because 10-year Treasuries lost to inflation for long stretches: -2.71% a year in real terms in the 1940s, -1.84% in the 1970s and -22.80% in 2022 alone.
- Below 4% the rule is very robust. 3.5% failed only once at 100% stocks (1929) and never at 50% to 75% stocks.
Why 1966 was worse than 1929
The crash of 1929 is the scary story, but a 60/40 retiree from 1929 survived the 4% rule. The deadly start was 1966. From 1966 to 1981, the S&P 500 returned 5.97% a year, but inflation averaged 7.01%, so stocks lost 0.97% a year in real terms for 16 years. Because the rule raises your withdrawal with inflation, by year 26 a 1966 retiree was taking 4.2 times as many dollars as in year one, from a portfolio that had shrunk in real terms.
That’s sequence-of-returns risk: bad real returns in the first decade do the damage, and later good years can’t repair a portfolio you’ve already sold down. Finxter’s sequence of returns risk example walks through the mechanism, and the 60/40 portfolio max drawdown post shows how deep those balanced-portfolio losses went.
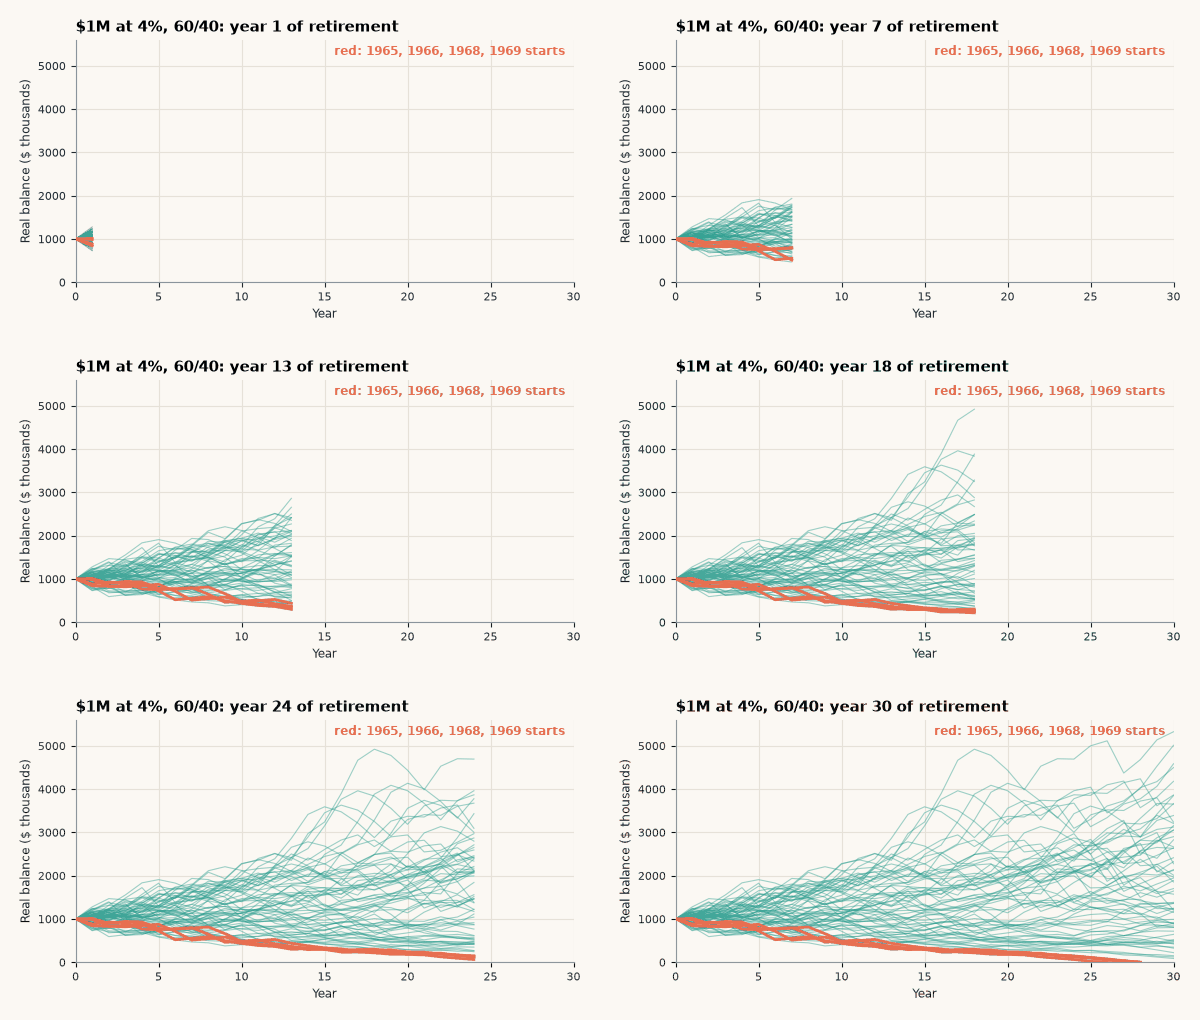
The 4% rule is about your first year only. You take 4% of the starting balance once, then raise that dollar amount with inflation, whatever the market does. Taking 4% of each year’s balance is a different strategy: it never runs out, but your income swings with the market.
The 4% rule for early retirement: 40 and 50 years
The rule was built for 30 years. A 45-year-old who retires early needs 40 or 50.
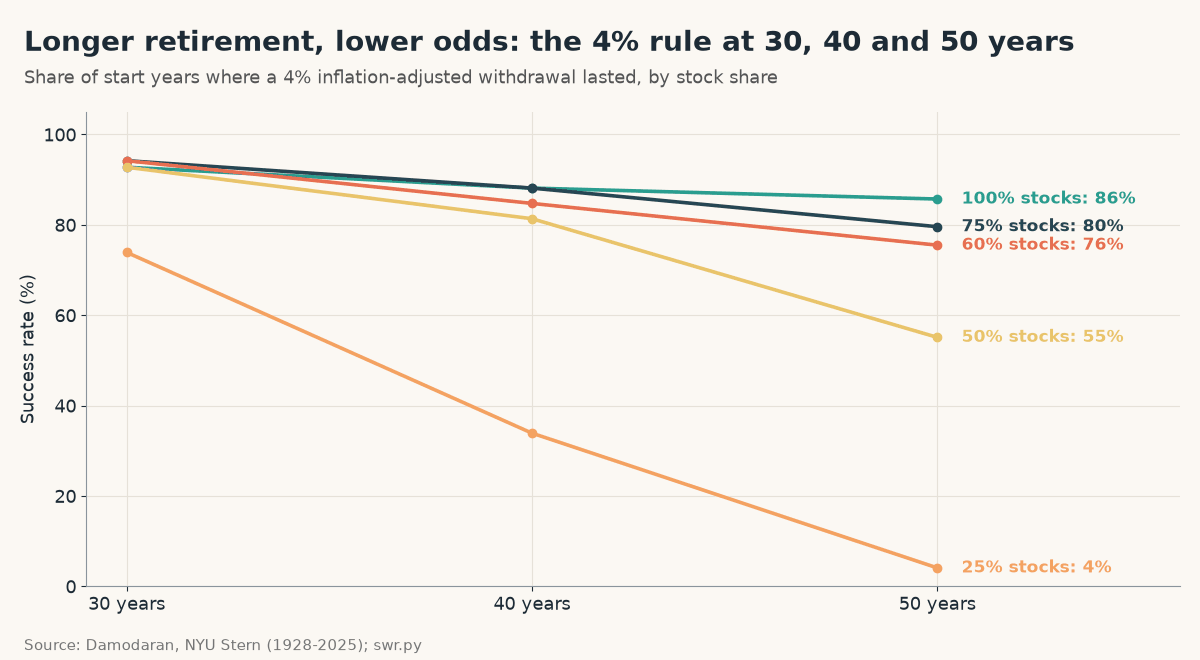
At 60/40, 4% survived 85% of 40-year retirements and 76% of 50-year ones. At 25% stocks, it survived only 4% of 50-year retirements: 2 of 49. Over long horizons, stocks were the safer asset for a fixed real withdrawal.
Morningstar reaches a similar conclusion with forward-looking assumptions instead of history: its 2025 research puts the safe starting rate at 3.9% for 30 years at a 90% success target, and its early-retirement estimates are 3.5% for 35 years, 3.3% for 40 and 2.9% for 50. In the historical data, 3.3% at 60/40 survived all 59 of the 40-year retirements.
Fees quietly break the 4% rule
Every backtest above assumes zero fees. A 1% advisory fee is effectively a higher withdrawal rate:
| Annual fee | 4% rule success, 60/40, 30 years |
|---|---|
| 0.00% | 65/69 (94%) |
| 0.25% | 64/69 (93%) |
| 0.50% | 62/69 (90%) |
| 1.00% | 59/69 (86%) |
At 0.25% (a cheap index-fund portfolio) you lose one start year. At 1%, success drops from 94% to 86% and ten start years fail. If you pay 1%, the fee-free equivalent is closer to a 3.5% rule.
Where today’s retirees stand
The data also shows how unfinished retirements are doing at the end of 2025 (4%, 60/40, real dollars, $1M start):
| Retired in | Years so far | Real balance end-2025 ($1M start) | Context |
|---|---|---|---|
| 2000 | 26 | $640,413 | dot-com crash, then 2008 |
| 2007 | 19 | $1,293,312 | retired into the 2008 crash |
| 2022 | 4 | $884,724 | stocks and bonds fell together |
The 2000 retiree started into two bear markets in nine years and still had $640,413 of real purchasing power after 26 years, with four years to go at about $40,000 a year in real terms: on track. The 2022 retiree had $884,724 after four years; it’s too early to call.
Run the 4% rule backtest yourself in Python
This script downloads Damodaran’s data and reproduces the core result. It needs pandas, xlrd and requests. If DataFrames are new to you, start with the Finxter pandas quickstart.
# 4% rule backtest: every 30-year US retirement since 1928 (pip install pandas xlrd requests)
import io, requests, pandas as pd
URL = "https://pages.stern.nyu.edu/~adamodar/pc/datasets/histretSP.xls"
raw = requests.get(URL, headers={"User-Agent": "Mozilla/5.0"}).content
d = pd.read_excel(io.BytesIO(raw), "Nominal vs Real Data", usecols=[0, 1, 3, 4])
d.columns = ["year", "stocks", "bonds", "infl"]
d = d[pd.to_numeric(d.year, errors="coerce").notna()].astype(float).set_index("year").loc[1928:2025]

def survives(start, rate=0.04, stock=0.60, years=30):
    bal, w = 1.0, rate
    for y in range(start, start + years):
        bal -= w                          # withdraw at the start of the year
        if bal <= 0: return False
        r = d.loc[y]
        bal *= 1 + stock * r.stocks + (1 - stock) * r.bonds   # rebalanced yearly
        w *= 1 + r.infl                   # raise spending with inflation
    return True

starts = range(1928, 2025 - 30 + 2)
for rate in (0.035, 0.04, 0.045, 0.05):
    ok = [s for s in starts if survives(s, rate)]
    bad = [s for s in starts if s not in ok]
    print(f"{rate:.1%}: {len(ok)}/{len(starts)} survived ({len(ok)/len(starts):.0%}); failed: {bad[:6]}{'...' if len(bad) > 6 else ''}")
Output:
3.5%: 69/69 survived (100%); failed: []
4.0%: 65/69 survived (94%); failed: [1965, 1966, 1968, 1969]
4.5%: 58/69 survived (84%); failed: [1937, 1962, 1963, 1964, 1965, 1966]...
5.0%: 50/69 survived (72%); failed: [1929, 1930, 1937, 1956, 1959, 1960]...
Change stock=0.60 or years=30 to test other mixes and horizons. To see how your actual holdings do against the index, track them in PortfolioTracker24, a free tracker that runs in your browser with no account, keeps your data local, compares your returns with the S&P 500 and backs up to Excel.
How to use these numbers
- Set a target, not a promise. 25x spending (4%) survived 94% of US history at 60/40. If failure would be a disaster, plan on 28.6x (3.5%), which never failed at 30 years with 50% to 75% stocks.
- Match the rate to the horizon. For 40+ years, plan nearer 3.3% to 3.5%, or keep at least 60% stocks.
- Count your fees. Subtract the fee from your withdrawal rate before you compare.
- Lower the rate you need. Any income that keeps coming, a pension, part-time work, royalties, comes straight off the withdrawal.
For the accumulation side, see what investing $500 a month for 20 years builds, and why stocks and bonds don’t always diversify each other.
FAQ
Does the 4% rule still work?
Historically, mostly yes. With 60% stocks and 40% 10-year Treasuries, 4% inflation-adjusted withdrawals lasted 30 years in 65 of 69 US retirements starting 1928 to 1996. Morningstar's forward-looking 2025 estimate is slightly lower, at 3.9%.
How much do I need to retire with the 4% rule?
25 times your yearly spending from the portfolio. Spending $40,000 a year means $1,000,000. Subtract pensions, Social Security or other steady income from spending first, because only the gap has to come from the portfolio.
When did the 4% rule fail?
In our backtest of a 60/40 portfolio, only for retirements starting in 1965, 1966, 1968 and 1969. High inflation and weak real stock returns in the 1970s drained those portfolios in year 26 to 28.
Is the 4% rule safe for early retirement?
Less so. A 4% withdrawal at 60/40 lasted 40 years in 85% of start years and 50 years in 76%. A 3.3% rate survived all 59 historical 40-year retirements.
What asset allocation works best for the 4% rule?
Between 50% and 100% stocks gave 93% to 94% success over 30 years. 25% stocks gave only 74%, and just 4% over 50 years, because bonds lost to inflation for long stretches.
Bottom line: the 4% rule held 94% of the time, and side income makes it bulletproof
The 4% rule is better than its critics say and worse than “multiply by 25” suggests: 65 of 69 historical 30-year retirements survived it, and the failures came from 1960s inflation, not the Great Depression. The surest way to sleep better is to need a lower rate.
Here’s the napkin math for that. Amazon KDP’s 70% royalty option pays 70% of the list price minus delivery costs, which Amazon says average $0.06 per unit: about $3.43 per $4.99 ebook. Assumption, not a typical result: a backlist that sold 120 copies a month would pay about $412 a month, $4,939 a year. On a $1M portfolio and $40,000 of spending, that cuts the withdrawal to $35,061, a 3.51% rate, and the backtest goes from 65 of 69 to 69 of 69 survived at 30 years. In 4% rule terms, $4,939 a year of income is worth $123,480 of portfolio. Book sales aren’t guaranteed, they usually fade over time, and many books sell far less.
If you want to try building that side income, ImagineYourBook turns an idea or your notes into a full text draft with a cover, ready to edit and publish on KDP. The 7-day trial is $0 with a card and includes one 10,000-word book; if you don’t cancel before day 8, the first charge is $24.99 a month. You still do the editing, the fact check and the marketing.
Sources (checked November 19, 2026): Aswath Damodaran (NYU Stern): Historical returns on stocks, bonds and bills, 1928-2025 · histretSP.xls (S&P 500, 10-year Treasury, CPI) · Bogleheads wiki: Safe withdrawal rates (Bengen 1994, Trinity study) · Morningstar: What’s a safe retirement withdrawal rate for 2026? · Morningstar: safe withdrawal rate for early retirement · Amazon KDP: eBook Royalties · ImagineYourBook pricing and trial terms · PortfolioTracker24. Scripts: swr.py (full analysis) and the short version shown above. Backtests ignore taxes and, unless stated, fees. Past returns don’t predict future returns. Not investment advice.