
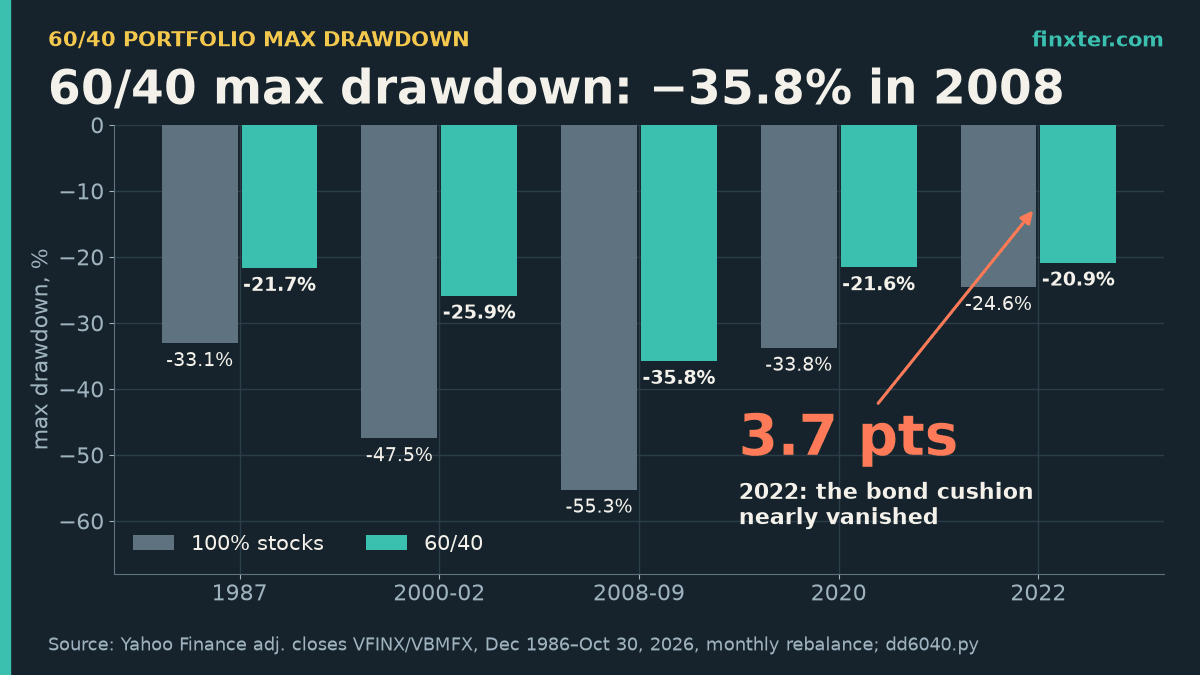
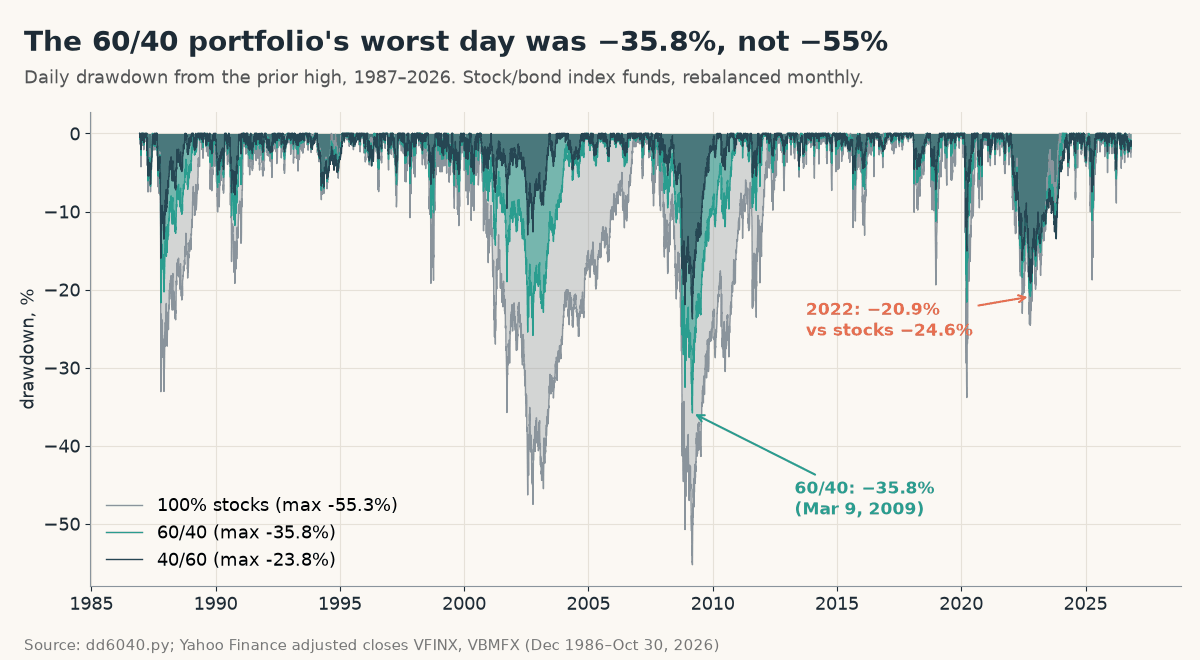
What is the 60/40 portfolio max drawdown? In a daily backtest of 60% S&P 500 index fund and 40% US total bond index fund, rebalanced monthly from December 1986 to October 30, 2026, the worst peak-to-trough loss was −35.8%, hit on March 9, 2009. The same stock fund alone fell −55.3% over the same stretch. So the classic 60/40 cut the worst loss by about a third.
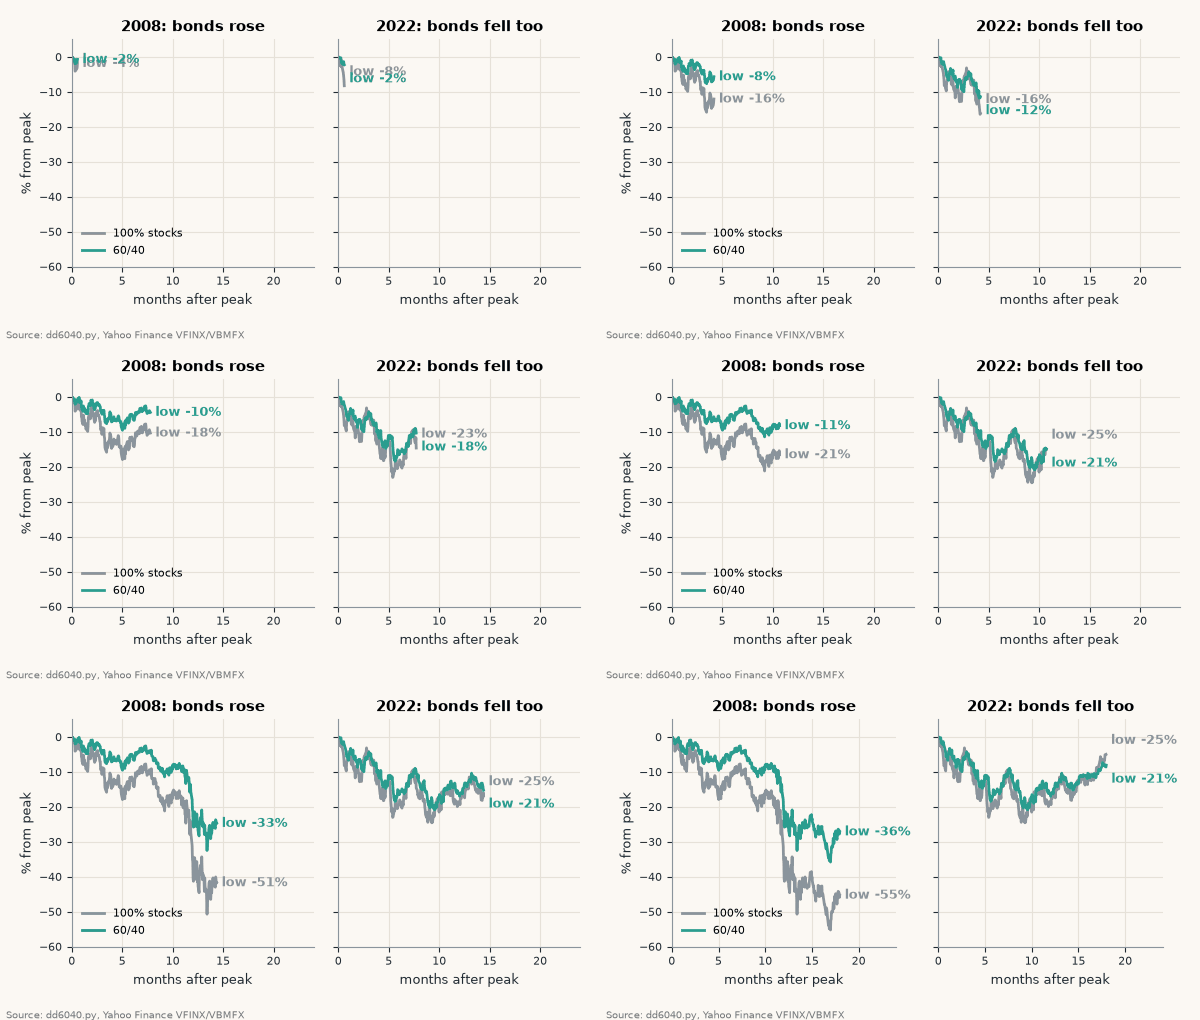
That cushion is not a constant, though. In 2008 bonds rose while stocks fell, and the 60/40 lost 19.5 points less than stocks. In 2022 both fell together, and the gap shrank to just 3.7 points (−20.9% vs −24.6%). The 60/40 even took longer than stocks to get back to a new high that time.
(If you turn your own investing rules into something you can share, an AI book-writing tool like ImagineYourBook can turn your notes into a draft finance ebook or lead magnet with Word and EPUB export. More on that at the end.)
TL;DR
- The 60/40 portfolio max drawdown was −35.8% (Mar 9, 2009) in daily data since Dec 1986, vs −55.3% for 100% stocks.
- In four of five crashes the 60/40 fell 54–66% as far as stocks. In 2022 it fell 85% as far: −20.9% vs −24.6%.
- Why: stock-bond daily correlation went from −0.35 in 2008 to +0.27 in 2022, as bonds lost 13.2%.
- Month-end data understates it: −32.5% instead of −35.8%.
- The cushion’s price: 8.89% vs 11.09% a year, so $10k became $297,508 instead of $661,370. Python script included.
How I measured the 60/40 max drawdown
“Max drawdown” is the largest drop from a running high to a later low, before a new high is set. The setup, kept simple and reproducible:
- Stocks: Vanguard 500 Index Fund Investor Shares (VFINX), which tracks the S&P 500.
- Bonds: Vanguard Total Bond Market Index Fund Investor Shares (VBMFX), which tracks the broad US investment-grade bond market.
- Data: daily adjusted closes from Yahoo Finance (dividends and interest reinvested, fund fees included), December 11, 1986 to October 30, 2026. That’s nearly 40 years and five big stock declines.
- Rebalancing: back to target weights on the first trading day of each month. No taxes, no trading costs.
I used index mutual funds instead of ETFs because they go back further. As a cross-check, I reran 2008 and 2022 with SPY and AGG (the ETF versions, AGG starts in 2003). The 60/40 drawdowns came out at −35.8% and −20.8%, within 0.1 points of the mutual-fund results.
One detail matters more than people think: daily vs month-end data. Measured on month-end values, the same 60/40 portfolio’s worst drawdown is only −32.5%. That’s the number you’ll see in most monthly backtests, including my rebalancing study. The real intraday-close low on March 9, 2009 was 3.3 points deeper. If you want to know how bad it actually felt, use daily data.
The answer, crash by crash
| Episode | 60/40 peak | 60/40 trough | 100% stocks max DD | 60/40 max DD | Cushion | Stocks: yrs to new high | 60/40: yrs to new high |
|---|---|---|---|---|---|---|---|
| Oct 1987 crash | Aug 25, 1987 | Oct 19, 1987 | −33.1% | −21.7% | 11.4 pts | 1.7 | 1.4 |
| Dot-com 2000–02 | Sep 01, 2000 | Oct 09, 2002 | −47.5% | −25.9% | 21.6 pts | 6.1 | 4.2 |
| 2008–09 crisis | Oct 09, 2007 | Mar 09, 2009 | −55.3% | −35.8% | 19.5 pts | 4.9 | 3.2 |
| COVID 2020 | Feb 19, 2020 | Mar 23, 2020 | −33.8% | −21.6% | 12.2 pts | 0.5 | 0.4 |
| 2022 bear market | Dec 27, 2021 | Oct 14, 2022 | −24.6% | −20.9% | 3.7 pts | 1.9 | 2.1 |
Across all five episodes, the 60/40 portfolio’s drawdown was between 54% and 85% of the stock fund’s drawdown. Four of the five cluster at 54–66%. The outlier is 2022, where the 60/40 still fell 85% as far as stocks did.
Here’s the napkin math for a real account. Say you hold $500,000 (an example, not a recommendation):
- 100% stocks at the 2008–09 low: −55.3%, so about $276,500 gone on paper.
- 60/40 at the same low: −35.8%, about $179,000 gone.
- In 2022: −24.6% for stocks ($123,000) vs −20.9% for the 60/40 ($104,500). The “safe” mix saved you only $18,500 that year.
Why 2022 broke the cushion
The 60/40 works when bonds zig while stocks zag. That depends on the correlation between the two, and it isn’t fixed. From the same daily data:
- 2008: the daily correlation between the stock and bond funds was −0.35. The stock fund lost 37.0% for the calendar year while the bond fund gained 5.1%.
- 2022: the correlation flipped to +0.27. The stock fund lost 18.2% and the bond fund lost 13.2% in the same year.
The reason was inflation and rate hikes. The Federal Reserve raised its target range from near zero in March 2022 to 4.25–4.50% by December 2022, and existing bonds lose value when rates jump. A bond fund that falls 13% can’t cushion a stock fund that falls 18%.
The bond side still hasn’t fully healed. VBMFX peaked on August 4, 2020, and on October 30, 2026 it was still 4.4% below that high on a total-return basis. Its max drawdown of −18.8% (October 2022) is the deepest in the fund’s history in this data.
That’s also why the 60/40 took 2.1 years to reach a new high after 2022, while stocks needed 1.9 years. In 2008 it was the other way round: 3.2 years for the 60/40 vs 4.9 years for stocks.
What the cushion costs you
Lower drawdowns aren’t free. Over the full period, every 20 points you move from stocks to bonds cuts the worst drawdown by roughly 9 to 12 points and costs about 1.0 to 1.2 points of annual return:
| Mix (stocks/bonds) | CAGR | Max drawdown (daily) | $10,000 grew to |
|---|---|---|---|
| 100% stocks | 11.09% | −55.3% | $661,370 |
| 80/20 | 10.04% | −46.3% | $452,010 |
| 60/40 | 8.89% | −35.8% | $297,508 |
| 40/60 | 7.65% | −23.8% | $188,700 |
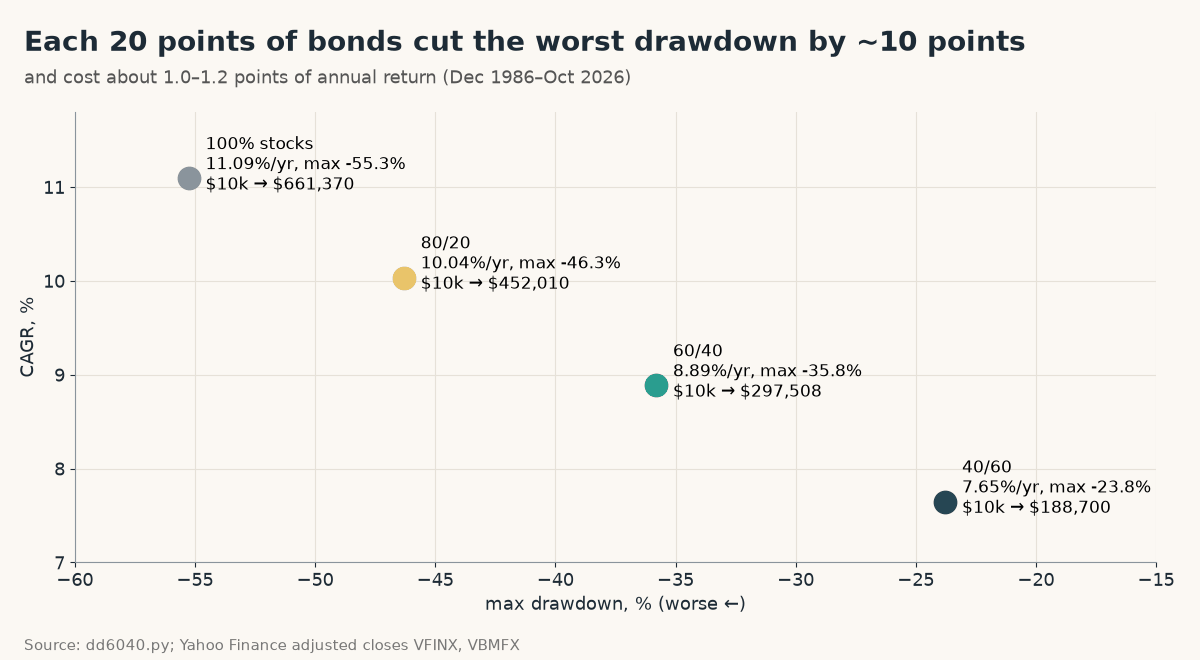
The dollar gap compounds. $10,000 in the stock fund in December 1986 grew to about $661,000. The same $10,000 in the 60/40 grew to about $298,000. That’s the price of a portfolio whose worst day was −35.8% instead of −55.3%.
Whether that’s worth it depends on one question: would you have sold at −55%? An investor who holds through −55% does better with stocks. An investor who panics at −40% and sells does much worse than a 60/40 holder who stays put. For more on that recovery side, see how long the stock market takes to recover from a crash.
Rule: plan for the 60/40’s real worst case, about −36% in daily data, and don’t count on bonds to cushion every crash. In 2022 they fell alongside stocks.
The Python script
This is the whole backtest. It needs pandas and yfinance (pip install pandas yfinance). Download the prices once, save them, and run it:
import yfinance as yf
yf.download(["VFINX", "VBMFX"], start="1986-01-01", auto_adjust=True)["Close"].to_pickle("src/prices.pkl")
"""60/40 portfolio max drawdown: VFINX (S&P 500 index fund) + VBMFX (US total bond index fund),
daily adjusted closes from Yahoo Finance, rebalanced to target on the first trading day of each month."""
import pandas as pd

def load(path="src/prices.pkl"):
    px = pd.read_pickle(path)[["VFINX", "VBMFX"]].dropna()
    return px.loc[:"2026-10-30"]

def portfolio(px, w_stock):
    r = px.pct_change().dropna()
    value, vals, w = 1.0, [], None
    month = None
    for day, row in r.iterrows():
        if day.month != month:                    # rebalance at start of each month
            month, w = day.month, {"VFINX": w_stock, "VBMFX": 1 - w_stock}
            hold = {k: value * v for k, v in w.items()}
        hold = {k: hold[k] * (1 + row[k]) for k in hold}
        value = sum(hold.values()); vals.append(value)
    return pd.Series(vals, index=r.index)

def drawdown(v):
    return v / v.cummax() - 1

def episode(v, start, end):
    """Max drawdown inside [start, end], peak date, trough date, recovery date."""
    dd = drawdown(v)
    trough = dd.loc[start:end].idxmin()
    peak = v.loc[:trough].idxmax()
    after = v.loc[trough:]
    rec = after[after >= v.loc[peak]]
    return dict(depth=dd.loc[trough], peak=peak, trough=trough,
                recovered=rec.index[0] if len(rec) else None)

def cagr(v):
    yrs = (v.index[-1] - v.index[0]).days / 365.25
    return (v.iloc[-1] / v.iloc[0]) ** (1 / yrs) - 1

if __name__ == "__main__":
    px = load()
    eps = {"1987 crash": ("1987-08-01", "1987-12-31"), "Dot-com 2000-02": ("2000-01-01", "2003-03-31"),
           "2008 crisis": ("2007-10-01", "2009-06-30"), "COVID 2020": ("2020-02-01", "2020-04-30"),
           "2022 bear": ("2022-01-01", "2022-12-31")}
    for w in (1.0, 0.8, 0.6, 0.4):
        v = portfolio(px, w)
        print(f"\n{int(w*100)}/{int(round((1-w)*100))}: CAGR {cagr(v):.2%}, max DD {drawdown(v).min():.1%}, "
              f"$10k -> ${10000*v.iloc[-1]:,.0f} ({v.index[0]:%b %Y}-{v.index[-1]:%b %Y})")
        for name, (a, b) in eps.items():
            e = episode(v, a, b)
            rec = e["recovered"]
            yrs = f"{(rec - e['peak']).days/365.25:.1f} yrs to new high" if rec is not None else "not recovered"
            print(f"  {name:16s} {e['depth']:7.1%}  peak {e['peak']:%Y-%m-%d} trough {e['trough']:%Y-%m-%d}  {yrs}")
    bonds = px["VBMFX"] / px["VBMFX"].iloc[0]
    e = episode(bonds, "2020-08-01", "2023-12-31")
    print(f"\nBonds alone (VBMFX): max DD {drawdown(bonds).min():.1%}, 2020-23 drawdown {e['depth']:.1%} trough {e['trough']:%Y-%m-%d} recovered {e['recovered']}")
Output (October 30, 2026 data):
100/0: CAGR 11.09%, max DD -55.3%, $10k -> $661,370 (Dec 1986-Oct 2026)
  1987 crash        -33.1%  peak 1987-08-25 trough 1987-10-19  1.7 yrs to new high
  Dot-com 2000-02   -47.5%  peak 2000-09-01 trough 2002-10-09  6.1 yrs to new high
  2008 crisis       -55.3%  peak 2007-10-09 trough 2009-03-09  4.9 yrs to new high
  COVID 2020        -33.8%  peak 2020-02-19 trough 2020-03-23  0.5 yrs to new high
  2022 bear         -24.6%  peak 2022-01-03 trough 2022-10-12  1.9 yrs to new high

80/20: CAGR 10.04%, max DD -46.3%, $10k -> $452,010 (Dec 1986-Oct 2026)
  1987 crash        -27.4%  peak 1987-08-25 trough 1987-10-19  1.7 yrs to new high
  Dot-com 2000-02   -37.5%  peak 2000-09-01 trough 2002-10-09  5.3 yrs to new high
  2008 crisis       -46.3%  peak 2007-10-09 trough 2009-03-09  3.5 yrs to new high
  COVID 2020        -27.9%  peak 2020-02-19 trough 2020-03-23  0.5 yrs to new high
  2022 bear         -22.6%  peak 2021-12-27 trough 2022-10-14  2.0 yrs to new high

60/40: CAGR 8.89%, max DD -35.8%, $10k -> $297,508 (Dec 1986-Oct 2026)
  1987 crash        -21.7%  peak 1987-08-25 trough 1987-10-19  1.4 yrs to new high
  Dot-com 2000-02   -25.9%  peak 2000-09-01 trough 2002-10-09  4.2 yrs to new high
  2008 crisis       -35.8%  peak 2007-10-09 trough 2009-03-09  3.2 yrs to new high
  COVID 2020        -21.6%  peak 2020-02-19 trough 2020-03-23  0.4 yrs to new high
  2022 bear         -20.9%  peak 2021-12-27 trough 2022-10-14  2.1 yrs to new high

40/60: CAGR 7.65%, max DD -23.8%, $10k -> $188,700 (Dec 1986-Oct 2026)
  1987 crash        -16.0%  peak 1987-08-25 trough 1987-10-19  1.1 yrs to new high
  Dot-com 2000-02   -13.0%  peak 2001-02-01 trough 2002-07-23  2.3 yrs to new high
  2008 crisis       -23.8%  peak 2007-12-06 trough 2009-03-09  2.3 yrs to new high
  COVID 2020        -15.1%  peak 2020-02-19 trough 2020-03-23  0.3 yrs to new high
  2022 bear         -19.2%  peak 2021-12-27 trough 2022-10-14  2.4 yrs to new high

Bonds alone (VBMFX): max DD -18.8%, 2020-23 drawdown -18.8% trough 2022-10-24 recovered None
Two things to try:
- Change
w_stockto your own mix, or swap in your own funds. - Change the rebalance rule. Monthly rebalancing is what this script does. My rebalancing study found annual rebalancing gave similar risk-adjusted results with far fewer trades.
If you’d rather see the observed drawdown of your actual holdings without writing code, PortfolioTracker24 is a free tracker that runs in your browser with no account or broker connection. It shows observed drawdown, Sharpe and Sortino, and compares your returns with the S&P 500 and Bitcoin, with Excel backups (prices are entered manually). For the risk-adjusted side, see Sharpe vs Sortino ratio and how to compare your portfolio to the S&P 500.
Summary: what to expect from a 60/40
| Question | What 1986–2026 data says | What to do |
|---|---|---|
| Worst loss to plan for | −35.8% (daily), −32.5% (month-end) | Size your stock share so you could hold through −36% |
| How much bonds help in a crash | 60/40 fell 54–66% as far as stocks in four of five crashes | Expect roughly a one-third cut, not immunity |
| When the cushion fails | 2022: stock-bond correlation +0.27, gap only 3.7 points | Don’t treat bonds as a guaranteed hedge when inflation and rates jump |
| Recovery time | 2008: 3.2 vs 4.9 years; 2022: 2.1 vs 1.9 years | 60/40 usually recovers faster, but not always |
| Cost of the cushion | 8.89% vs 11.09% a year; $297,508 vs $661,370 per $10k | Only worth it if it stops you from selling in a crash |
Limitations
- This is US-only: one S&P 500 fund and one US bond fund. Global or inflation-linked bonds would behave differently.
- 40 years is still a small sample: five big stock declines, and only one with stocks and bonds falling hard together.
- No taxes or trading costs. Monthly rebalancing in a taxable account would cost something.
- Past drawdowns are history, not a forecast. The next −35% could come from a different mix of stock and bond moves.
The takeaway
The honest answer to “what is the 60/40 portfolio max drawdown” is −35.8% in daily data since 1987, about two-thirds of the stock market’s −55.3%. Plan for that number, not the −20% people assume. And remember that the bond cushion depends on bonds and stocks moving in opposite directions. In 2022 they didn’t, and the 60/40 lost almost as much as stocks.
If this kind of analysis is how you think about money, you could package your own rules into a short investing guide or lead magnet for readers or clients. ImagineYourBook turns a prompt or notes into a complete draft with a cover and Word/EPUB export. The trial is $0 today with a card and includes one 10,000-word book; the first $29.99 payment starts after 7 days unless you cancel before day 8. Check the numbers in any draft yourself, same as you would with this backtest.
Sources (checked November 1, 2026): Yahoo Finance: VFINX history · Yahoo Finance: VBMFX history · Yahoo Finance: AGG (cross-check) · Federal Reserve: FOMC target rate history · yfinance on GitHub · ImagineYourBook pricing and trial terms. Script: dd6040.py (shown above). Not investment advice.