
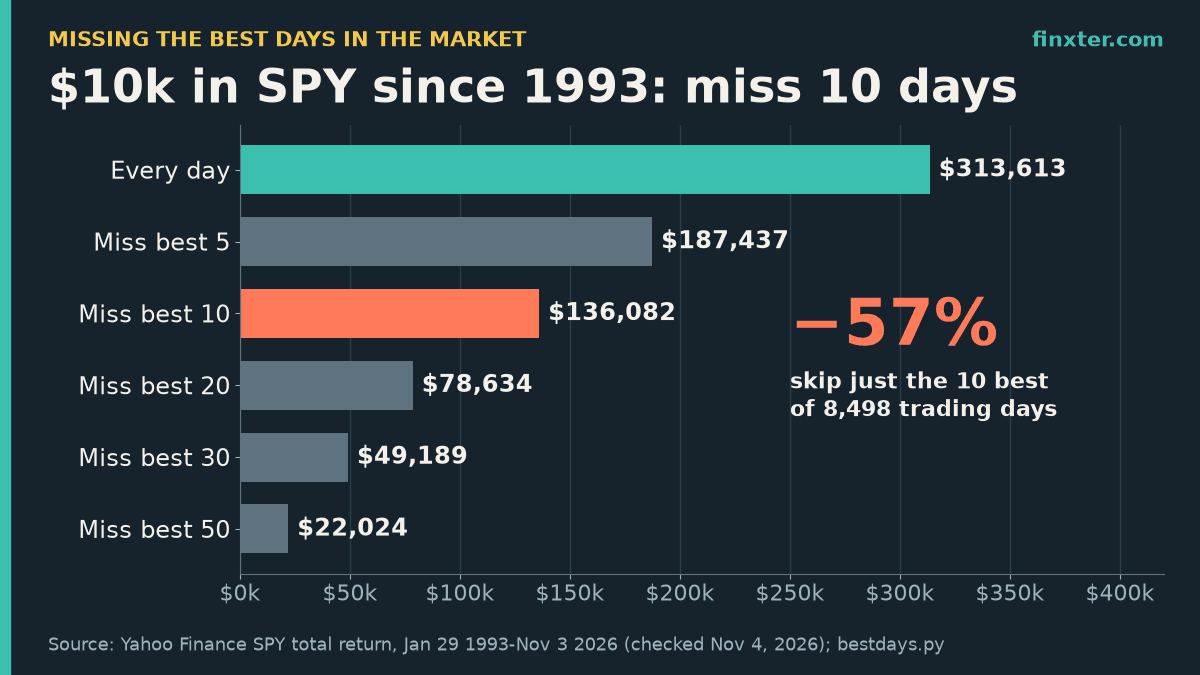
Short answer: missing the best days in the market is brutally expensive. $10,000 put into SPY at its first close on January 29, 1993 grew to $313,613 by November 3, 2026 with dividends reinvested. Sit in cash on just the 10 best days out of 8,498 trading days, and the same money ends at $136,082. That is 57% less, from 0.12% of the days.
The catch most charts leave out: those 10 best days were not random. Eight of them came within 10 trading days of one of the 20 worst days, and nine came while SPY was more than 20% below its peak. You can’t skip the crashes and keep the rebounds, because they happen in the same weeks. I ran the numbers on real Yahoo Finance data with a short Python script you can copy below.
TL;DR
- $10,000 in SPY from Jan 29, 1993: $313,613 invested every day vs $136,082 after missing the 10 best days (−57%).
- Missing 5 days cost 40%, 20 days 75%, 50 days 93%. In the last 20 years, missing 50 days turned $10,000 into $6,917.
- 8 of the 10 best days came within 10 trading days of a top-20 worst day; 9 of 10 came in a 20%+ bear market.
- J.P. Morgan’s 2006–2025 S&P 500 version agrees: $80,619 vs $35,866.
- Skipping both the 10 best and 10 worst days gave $326,292, barely more than holding. Python script included.
If you’re the friend who always ends up explaining “time in the market” to your family or your investing club, this kind of worked example is exactly what makes a good beginner’s investing guide or newsletter lead magnet. ImagineYourBook is an AI book-writing tool that turns a prompt or your own notes into a complete ~10,000-word draft with a designed cover, exported to Word and EPUB, so your charts and rules of thumb can become a short finance ebook you then edit and fact-check.
What “missing the best days” actually means
The test is simple. Take every trading day of an index fund. Rank the daily returns. Then replay history twice: once fully invested, and once sitting in cash on the N biggest up-days. Everything else stays identical.
My setup, so you can check it:
- Data: SPY daily adjusted closes from Yahoo Finance via the open-source yfinance library, January 29, 1993 (SPY’s first trading day) to November 3, 2026. The adjusted close includes reinvested dividends, so this is total return.
- Cash on missed days earns 0%. This is an assumption, and it’s the same one J.P. Morgan uses. It slightly overstates the damage when T-bills pay 4–5%, but a day of T-bill interest is about 0.02%, nothing next to a +10% day.
- No fees, taxes or trading costs. Real market timers would also pay spreads and, in taxable accounts, capital gains tax on every exit.
The cost of missing the best days, in dollars
Here is the full table. The “last 20 years” rows start on November 3, 2006, for comparison with the famous J.P. Morgan chart.
| Scenario ($10,000 in SPY) | Since Jan 1993 | CAGR | vs every day | Last 20 years | CAGR | vs every day |
|---|---|---|---|---|---|---|
| Invested every day | $313,613 | 10.74% | — | $79,634 | 10.93% | — |
| Miss the 5 best days | $187,437 | 9.07% | -40% | $47,595 | 8.11% | -40% |
| Miss the 10 best days | $136,082 | 8.04% | -57% | $34,554 | 6.40% | -57% |
| Miss the 20 best days | $78,634 | 6.30% | -75% | $20,784 | 3.73% | -74% |
| Miss the 30 best days | $49,189 | 4.83% | -84% | $13,803 | 1.62% | -83% |
| Miss the 50 best days | $22,024 | 2.37% | -93% | $6,917 | -1.83% | -91% |
Missing five days costs 40%. Missing 10 costs 57%. Miss 50 of the best days in the last 20 years and $10,000 turns into $6,917: you would have lost money in a period when the market compounded at 10.93% a year.
The 10-day line is the same −57% in both windows because all 10 of the best days since 1993 fell after 2006: six in the 2008–2009 crash, three in the 2020 COVID crash, one in April 2025.
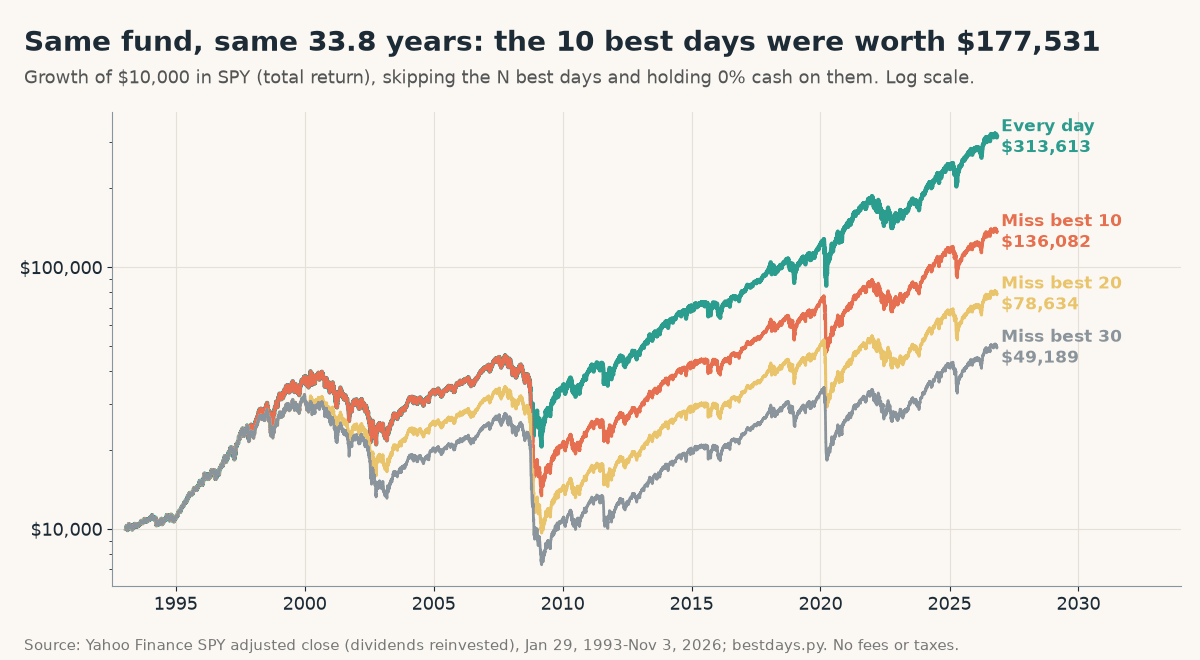
Note how all four lines move together for 15 years. Then October 2008 hits, and the gap opens in a few weeks and never closes. That is the whole story of missing the best days: years of nothing, then a handful of sessions that decide the result.
My numbers line up with the most-cited version of this chart. J.P. Morgan’s Guide to Retirement 2026 uses the S&P 500 Total Return Index from January 2, 2006 to December 31, 2025: $10,000 became $80,619 (11.0% a year) fully invested, and $35,866 (6.6%) after missing the 10 best days. My SPY window, November 2006 to November 2026, gives $79,634 (10.93%) and $34,554 (6.40%). SPY’s ~0.09% expense ratio and the slightly different dates explain the small gap.
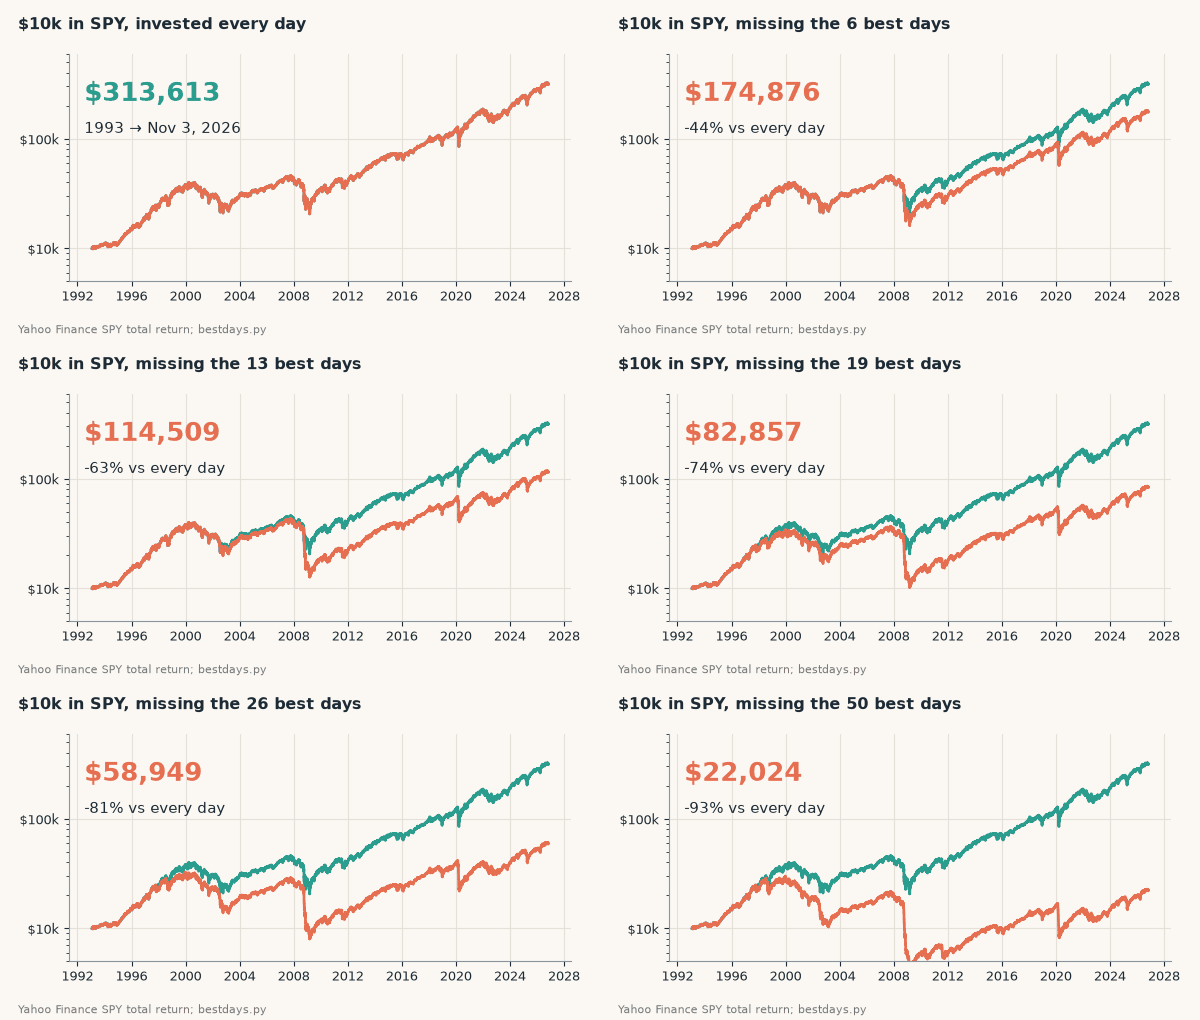
The animation below removes the best days one at a time. Watch how quickly the ending value collapses:
Why you can’t dodge the bad days and keep the good ones
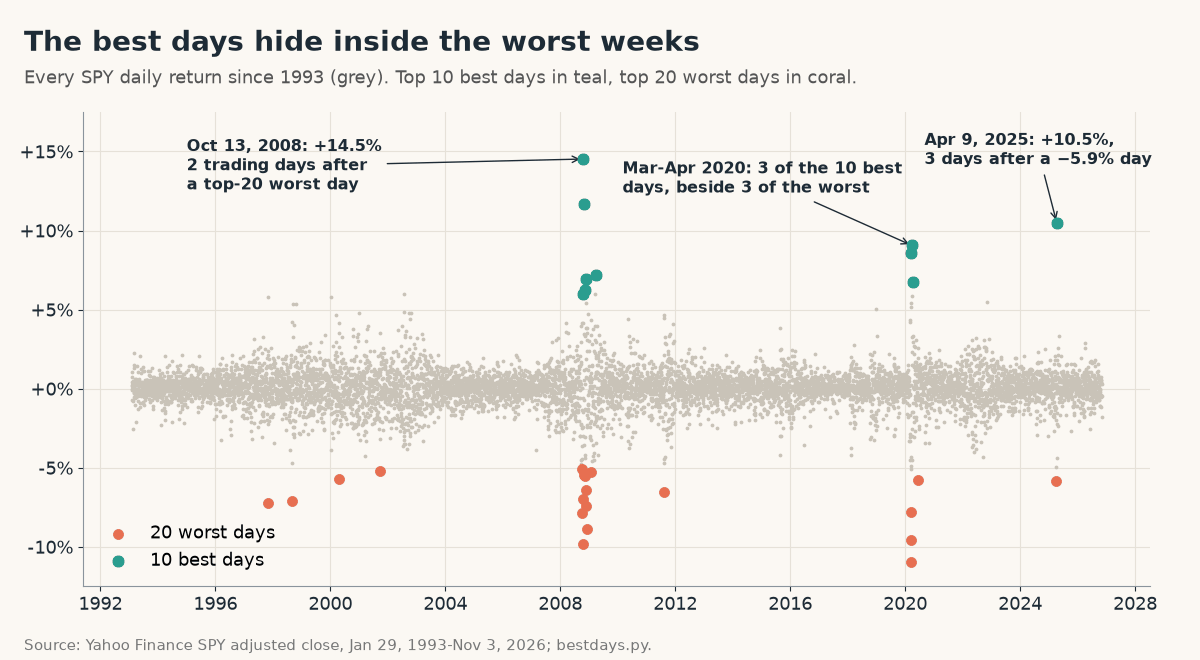
The “missing the best days” chart is often used to say “never sell.” The data supports that, but for a more interesting reason than the chart shows. Look at when the best days happened:
| SPY’s 10 best days | Return | SPY vs prior peak | Nearest top-20 worst day | Worst day came |
|---|---|---|---|---|
| Oct 13, 2008 | +14.5% | -34% | Oct 09, 2008 (-7.0%) | 2 trading days before |
| Oct 28, 2008 | +11.7% | -39% | Oct 22, 2008 (-5.4%) | 4 trading days before |
| Apr 09, 2025 | +10.5% | -10% | Apr 04, 2025 (-5.9%) | 3 trading days before |
| Mar 24, 2020 | +9.1% | -28% | Mar 16, 2020 (-10.9%) | 6 trading days before |
| Mar 13, 2020 | +8.5% | -20% | Mar 12, 2020 (-9.6%) | 1 trading days before |
| Mar 23, 2009 | +7.2% | -46% | Jan 20, 2009 (-5.3%) | 43 trading days before |
| Nov 24, 2008 | +6.9% | -45% | Nov 20, 2008 (-7.4%) | 2 trading days before |
| Apr 06, 2020 | +6.7% | -21% | Mar 16, 2020 (-10.9%) | 15 trading days before |
| Nov 13, 2008 | +6.2% | -41% | Nov 19, 2008 (-6.4%) | 4 trading days after |
| Oct 20, 2008 | +6.0% | -36% | Oct 22, 2008 (-5.4%) | 2 trading days after |
Three numbers from the script tell the story:
- 8 of the 10 best days came within 10 trading days of one of the 20 worst days. October 13, 2008 (+14.5%) came two sessions after the October 9 drop of −7.0%. March 13, 2020 (+8.5%) came one session after March 12 (−9.6%).
- 9 of the 10 best days came while SPY was more than 20% below its previous high. Only 17% of all trading days since 1993 were spent that deep in a drawdown.
- The one exception, April 9, 2025 (+10.5%), came three days after SPY’s −5.9% day on April 4, 2025, while SPY was about 10% below its peak.
So the best days are bear-market days. The person who sold after a −7% day, “to wait until things calm down”, is precisely the person who misses the +14.5% day two sessions later.
The one-sided chart problem: “missing the best days” charts never show that missing the worst days would have helped even more ($751,970 here). The real lesson isn’t that the best days are magic. It’s that nobody gets to skip the worst days without also skipping the best ones that follow.
The fair version of the experiment cuts both ways. Missing the 10 worst days would have turned $10,000 into $751,970. Missing both the 10 best and the 10 worst ends at $326,292, almost exactly the $313,613 of simply staying invested. In other words, someone who somehow dodged both tails would end up only about 4% ahead after 33.8 years. A real one, who sells after the crash and buys back after the rebound, is in the $136,082 row.
If you’ve already read how long the stock market takes to recover from a crash, this is the other half of that answer: the recovery starts with these violent up-days, often while the headlines are still bad.
The Python script (copy, run, change the ticker)
The whole analysis fits in about 40 lines of pandas. Install yfinance and pandas, then run it. If you’re new to Python, Finxter’s Python crash course covers everything you need for this script.
# bestdays.py - what does missing the best days in the market cost? (pip install yfinance pandas)
import pandas as pd, yfinance as yf

START, END, CASH = "1993-01-29", "2026-11-04", 10_000   # SPY's first close -> last close (Nov 3, 2026)

def load(ticker="SPY", start=START):
    px = yf.download(ticker, start=start, end=END, auto_adjust=True, progress=False)["Close"].squeeze()
    return px.pct_change().dropna()                     # daily total returns (dividends included)

def grow(r, skip=()):
    """$10k path; on skipped days you sit in cash earning 0% (assumption)."""
    path = CASH * (1 + r.where(~r.index.isin(skip), 0.0)).cumprod()
    start = r.index[0] - pd.tseries.offsets.BDay(1)     # day 0 = $10k at the first close
    return pd.concat([pd.Series({start: CASH}), path])

def cagr(path):
    yrs = (path.index[-1] - path.index[0]).days / 365.25
    return (path.iloc[-1] / CASH) ** (1 / yrs) - 1

def report(r, label):
    best, worst = r.nlargest(50).index, r.nsmallest(50).index
    print(f"--- {label}: {len(r):,} trading days to {r.index[-1]:%Y-%m-%d}")
    for n in (0, 5, 10, 20, 30, 50):
        p = grow(r, best[:n])
        print(f"miss best {n:>2}: ${p.iloc[-1]:>9,.0f}  CAGR {cagr(p):.2%}")
    for n in (10, 20):
        p, q = grow(r, worst[:n]), grow(r, best[:n].union(worst[:n]))
        print(f"miss worst {n}: ${p.iloc[-1]:,.0f} ({cagr(p):.2%}) | miss best+worst {n}: ${q.iloc[-1]:,.0f} ({cagr(q):.2%})")
    return best, worst

if __name__ == "__main__":
    r = load()
    best, worst = report(r, "SPY since Jan 29, 1993")
    report(r[r.index > "2006-11-03"], "SPY last 20 years")
    wealth = (1 + r).cumprod(); dd = wealth / wealth.cummax() - 1
    near = [min(abs(r.index.get_loc(b) - r.index.get_loc(w)) for w in worst[:20]) for b in best[:10]]
    print("10 best days:", ", ".join(f"{d:%Y-%m-%d} {r[d]:+.1%}" for d in best[:10]))
    print(f"trading days to nearest top-20 worst day: {near} -> {sum(g <= 10 for g in near)}/10 within 10")
    print(f"best 10 days in a 20%+ drawdown: {(dd[best[:10]] < -0.2).sum()}/10 (all days: {(dd < -0.2).mean():.0%})")
Output on November 4, 2026 (Yahoo data through the November 3 close):
--- SPY since Jan 29, 1993: 8,498 trading days to 2026-11-03
miss best  0: $  313,613  CAGR 10.74%
miss best  5: $  187,437  CAGR 9.07%
miss best 10: $  136,082  CAGR 8.04%
miss best 20: $   78,634  CAGR 6.30%
miss best 30: $   49,189  CAGR 4.83%
miss best 50: $   22,024  CAGR 2.37%
miss worst 10: $751,970 (13.65%) | miss best+worst 10: $326,292 (10.88%)
miss worst 20: $1,350,227 (15.64%) | miss best+worst 20: $338,549 (11.00%)
--- SPY last 20 years: 5,029 trading days to 2026-11-03
miss best  0: $   79,634  CAGR 10.93%
miss best  5: $   47,595  CAGR 8.11%
miss best 10: $   34,554  CAGR 6.40%
miss best 20: $   20,784  CAGR 3.73%
miss best 30: $   13,803  CAGR 1.62%
miss best 50: $    6,917  CAGR -1.83%
miss worst 10: $187,972 (15.80%) | miss best+worst 10: $81,564 (11.06%)
miss worst 20: $324,161 (19.00%) | miss best+worst 20: $84,604 (11.27%)
10 best days: 2008-10-13 +14.5%, 2008-10-28 +11.7%, 2025-04-09 +10.5%, 2020-03-24 +9.1%, 2020-03-13 +8.5%, 2009-03-23 +7.2%, 2008-11-24 +6.9%, 2020-04-06 +6.7%, 2008-11-13 +6.2%, 2008-10-20 +6.0%
trading days to nearest top-20 worst day: [2, 4, 3, 6, 1, 43, 2, 15, 4, 2] -> 8/10 within 10
best 10 days in a 20%+ drawdown: 9/10 (all days: 17%)
Three easy modifications:
- Another fund:
load("QQQ")orload("VT"), and check whether its best days sit in the same crash windows. - A cash yield: replace the
0.0ingrow()with a daily T-bill rate, e.g.0.04 / 252, to test the 0% assumption. - Your own exits: pass the dates you were actually out of the market as
skipand see what they cost.
That last one is the honest test. To see what your real trades did against simply buying the index on the same dates, PortfolioTracker24 is a free browser tracker (no account, no broker connection, data stays in your browser with Excel backups) that compares your dated purchases and sales to the same cash flows in the S&P 500 and Bitcoin. For the math behind that comparison, see compare my portfolio to the S&P 500, and for the closely related “wait for a dip” question, lump sum vs DCA in the S&P 500.
What to do with this
| Question | What the SPY data says | What to do |
|---|---|---|
| What does missing the best days cost? | 10 days: $313,613 → $136,082 (−57%); 50 days: −93% | Stay invested through volatile weeks |
| When do the best days happen? | 9 of 10 in a 20%+ drawdown; 8 of 10 within 10 days of a top-20 worst day | Treat a crash week as the worst time to sell |
| Can’t I just skip the worst days too? | Skipping both best and worst 10: $326,292, only ~4% above holding | Not worth the risk of mistiming |
| Is it a real effect or a 2008 artifact? | J.P. Morgan 2006–2025: $80,619 vs $35,866 (11.0% vs 6.6%) | Assume it applies to the next crash too |
| What if the swings are too much? | 60/40 fell −35.8% in 2008 vs −55.2% for SPY | Lower your stock share, don’t time exits |
If the swings themselves are what make you want to sell, the fix is the allocation, not the timing. A 60/40 mix fell −35.8% at its 2008 low (see the 60/40 portfolio max drawdown analysis), versus −55.2% for SPY in the same data, and is much easier to hold through the weeks where the best days happen.
Limitations. This is one fund, one country, and 33.8 years of history, not a forecast. The cash-at-0% and no-tax assumptions are simplifications. And no investor misses exactly the 10 best days; the point is that the days you’d be most tempted to be out are the days that carry the result.
FAQ
What happens if you miss the 10 best days in the stock market?
In SPY from January 1993 to November 3, 2026, $10,000 grew to $313,613 fully invested but only $136,082 after missing the 10 best days. That is 57% less money, and the annual return falls from 10.74% to 8.04%.
Why do the best days happen near the worst days?
Big up-days come in high-volatility crashes. Eight of SPY's 10 best days since 1993 fell within 10 trading days of one of its 20 worst days, and nine came while SPY was more than 20% below its peak.
Is missing the best days in the market a myth?
No, but the usual chart is one-sided. Missing SPY's 10 worst days would have produced $751,970, and missing both the 10 best and 10 worst gave $326,292. Since nobody can pick either set in advance, staying invested wins in practice.
What did J.P. Morgan find about missing the best days?
J.P. Morgan's Guide to Retirement 2026 shows $10,000 in the S&P 500 Total Return Index from 2006 to 2025 growing to $80,619 fully invested and $35,866 after missing the 10 best days: 11.0% vs 6.6% a year.
Should I sell stocks before a market crash?
History says selling after big drops usually means missing the rebound. October 13, 2008 (+14.5%) came two trading days after a −7.0% day. If volatility worries you, lower your stock allocation instead of trying to time exits.
The takeaway
Missing the best days in the market cost 57% of the ending value since 1993, and those days sit right next to the worst days. The practical rule is boring: pick an allocation you can hold through a −10% session, automate your contributions, and don’t sell in the panic week.
And if you’ve built up your own investing rules, scripts and charts over the years, they’re worth packaging. A short guide like “Stay Invested: What 33 Years of SPY Data Say” makes a solid newsletter lead magnet or Kindle ebook. ImagineYourBook can turn your notes into a ~10,000-word draft with Word and EPUB export. The 7-day trial is $0 today with a card required, includes one 10k-word Small Book, and becomes $24.99/month unless you cancel before day 8. It writes text books with a cover, not picture books, and you still own the job of checking every number.
Sources (checked November 4, 2026): Yahoo Finance: SPY history · yfinance on GitHub · J.P. Morgan Guide to Retirement 2026 (PDF) · Finxter: 60/40 max drawdown · ImagineYourBook pricing and trial terms. Script: bestdays.py (shown above). Not investment advice.