
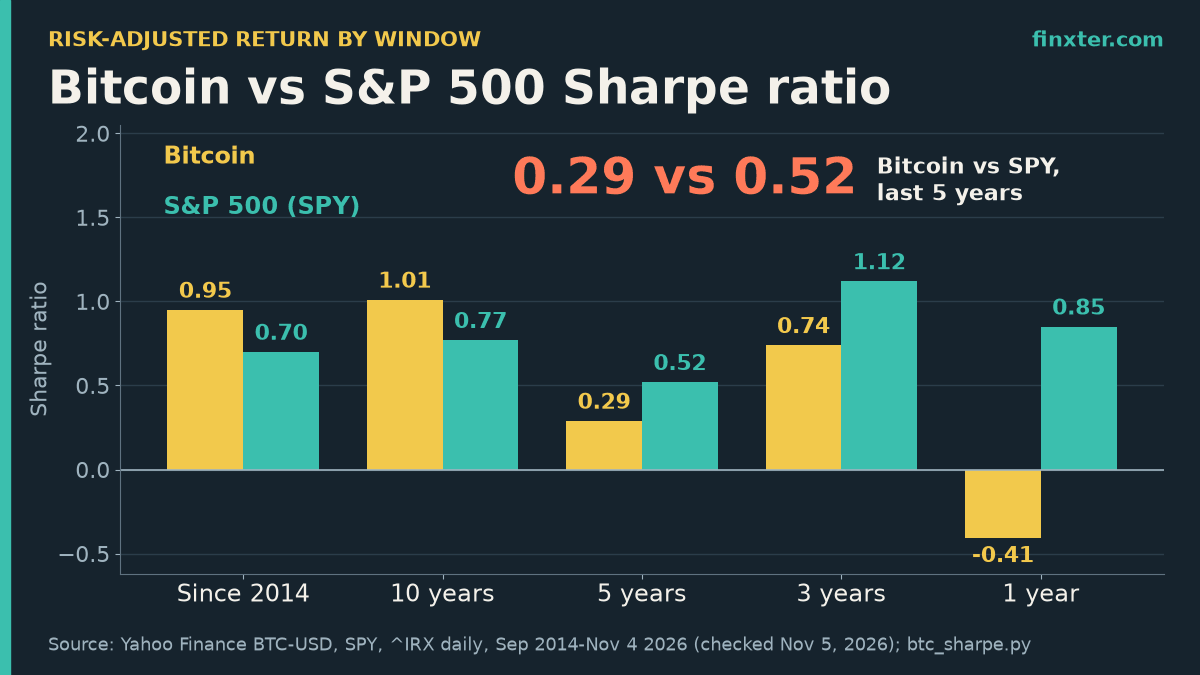
Short answer: on the full record, Bitcoin has the higher Sharpe ratio. From September 2014 to November 4, 2026, Bitcoin (BTC-USD) scored 0.95 and the S&P 500 (SPY) scored 0.70, so Bitcoin earned more excess return per unit of volatility. Shorten the window and the answer flips. Over the last 5 years it’s 0.29 vs 0.52, over 3 years 0.74 vs 1.12, and over the last 12 months −0.41 vs 0.85, all in favor of the S&P 500.
So “bitcoin vs s&p 500 sharpe ratio” doesn’t have one answer. It depends on your start date. Below are the numbers for every window, why they differ, the mistake that makes many published Bitcoin Sharpe ratios wrong, and a short Python script so you can recheck them tomorrow.
TL;DR
- Since Sep 2014: Bitcoin’s Sharpe ratio is 0.95 vs 0.70 for the S&P 500 (SPY), on 3,051 trading days to Nov 4, 2026.
- Last 5 years: SPY wins 0.52 vs 0.29. Last 3 years: 1.12 vs 0.74. Last 12 months: 0.85 vs −0.41.
- Pick any start year from 2021 to 2025 and SPY has the higher Sharpe every time. Bitcoin led in 58% of rolling 1-year windows overall, 46% since 2021.
- Annualizing Bitcoin’s 7-day returns with √252 instead of √365 understates its Sharpe: 0.79 instead of 0.95.
- A 5% Bitcoin sleeve raised portfolio Sharpe from 0.70 to 0.89 since 2014, but only 0.52 to 0.54 over the last 5 years. Python script included.
One side note before the math. If you’ve been keeping notes like these and want to turn them into a short investing ebook or a lead magnet for your newsletter, ImagineYourBook is an AI book-writing tool that turns a prompt or your notes into a roughly 10,000-word draft with a cover and Word/EPUB export. You still check every number yourself.
The Sharpe ratio in one line (and the data used)
William Sharpe defined the ratio as the average excess return (your return minus the risk-free rate) divided by the standard deviation of that excess return. In his 1994 paper he recommends measuring over short periods and then annualizing. Here’s the setup:
- Prices: daily adjusted closes from Yahoo Finance for BTC-USD and SPY. SPY’s adjusted close includes reinvested dividends, so it works as an S&P 500 total-return proxy.
- Risk-free rate: the 13-week US Treasury bill yield (^IRX), converted to a daily rate. It averaged 2.03% over the period and was 4.03% on November 4, 2026.
- Period: 3,051 SPY trading days, from September 18, 2014 (Yahoo’s first BTC-USD close is September 17) to November 4, 2026.
- Alignment: both assets use SPY trading days. Bitcoin’s weekend moves roll into Monday’s return, so both series are annualized with √252 (more on why this matters below).
Bitcoin vs S&P 500 Sharpe ratio, window by window
| Window (to Nov 4, 2026) | Sharpe BTC / SPY | Sortino BTC / SPY | CAGR BTC / SPY | Volatility BTC / SPY | Max drawdown BTC / SPY | Higher Sharpe |
|---|---|---|---|---|---|---|
| Since Sep 2014 | 0.95 / 0.70 | 1.43 / 0.99 | 53.26% / 13.60% | 65.4% / 17.4% | -83.0% / -33.7% | Bitcoin |
| 10 years | 1.01 / 0.77 | 1.53 / 1.08 | 60.87% / 15.77% | 66.3% / 18.0% | -83.0% / -33.7% | Bitcoin |
| 5 years | 0.29 / 0.52 | 0.42 / 0.75 | 5.55% / 11.98% | 51.6% / 17.2% | -76.6% / -24.5% | S&P 500 |
| 3 years | 0.74 / 1.12 | 1.14 / 1.67 | 32.48% / 22.43% | 47.6% / 15.2% | -53.1% / -18.8% | S&P 500 |
| 1 year | -0.41 / 0.85 | -0.58 / 1.25 | -20.93% / 14.85% | 43.4% / 12.8% | -44.8% / -8.9% | S&P 500 |
Bitcoin’s lead over the full sample is real, but it comes from its early years. A 53.26% compound annual return is so large that even 65.4% annualized volatility (3.8× SPY’s 17.4%) can’t drag the ratio below SPY’s. The table also shows what the Sharpe ratio hides: Bitcoin’s worst peak-to-trough fall was −83.0%, against −33.7% for SPY. Sharpe treats upside and downside swings the same, which is why I also show Sortino. Bitcoin leads on that too over the full sample (1.43 vs 0.99), but not over 5, 3 or 1 years. For the difference between the two ratios, see the Sharpe ratio vs Sortino ratio breakdown.
The last 12 months explain the flip at the short end. Bitcoin’s highest close in this data was $124,752.53 on October 6, 2025. On November 4, 2026 it closed at $80,405, 35.5% lower. Over the same year SPY returned 14.85%.
Rolling 1-year Sharpe: who leads, and how often?
A single number per window still hides how unstable the comparison is. The chart below recomputes both ratios every day over the trailing 252 trading days.
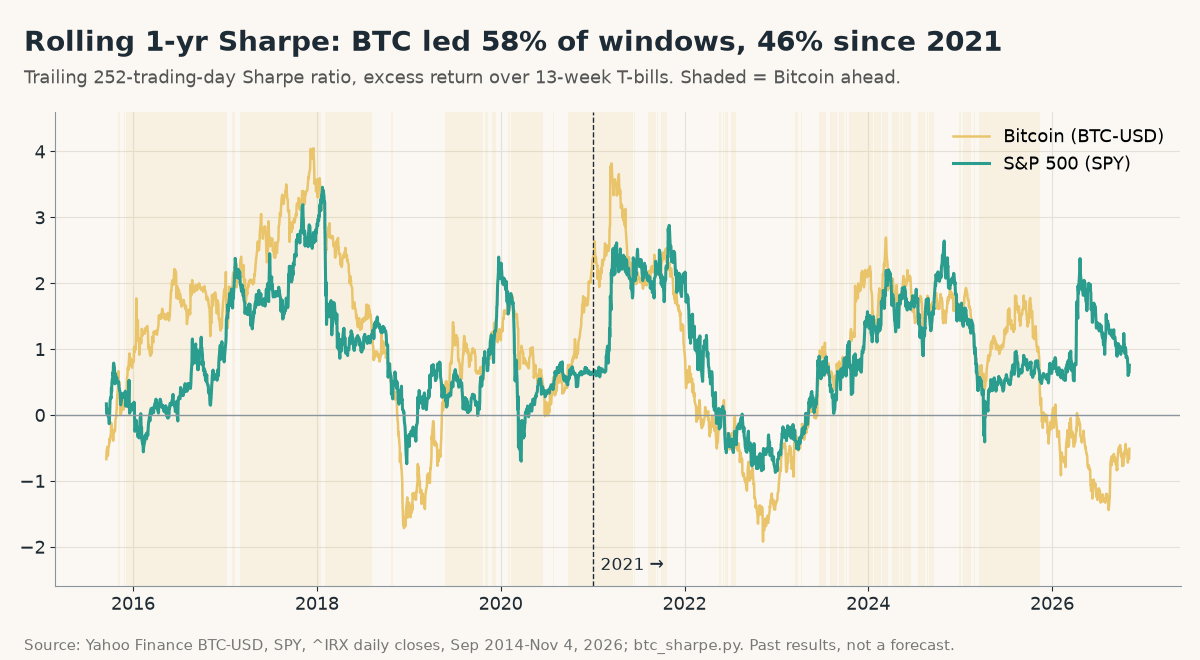
Out of 2,800 rolling one-year windows, Bitcoin had the higher Sharpe in 58%. For windows ending in 2021 or later, that drops to 46%. Bitcoin’s line also swings far more, from about +4 at the end of 2017 to below −1.5 around the start of 2019 and in late 2022. SPY’s line moves less, partly because its volatility is about a quarter of Bitcoin’s.
Your start year decides the winner
This is the part most “Bitcoin vs S&P 500” charts skip. I froze the end date at November 4, 2026 and moved the start date one January at a time:
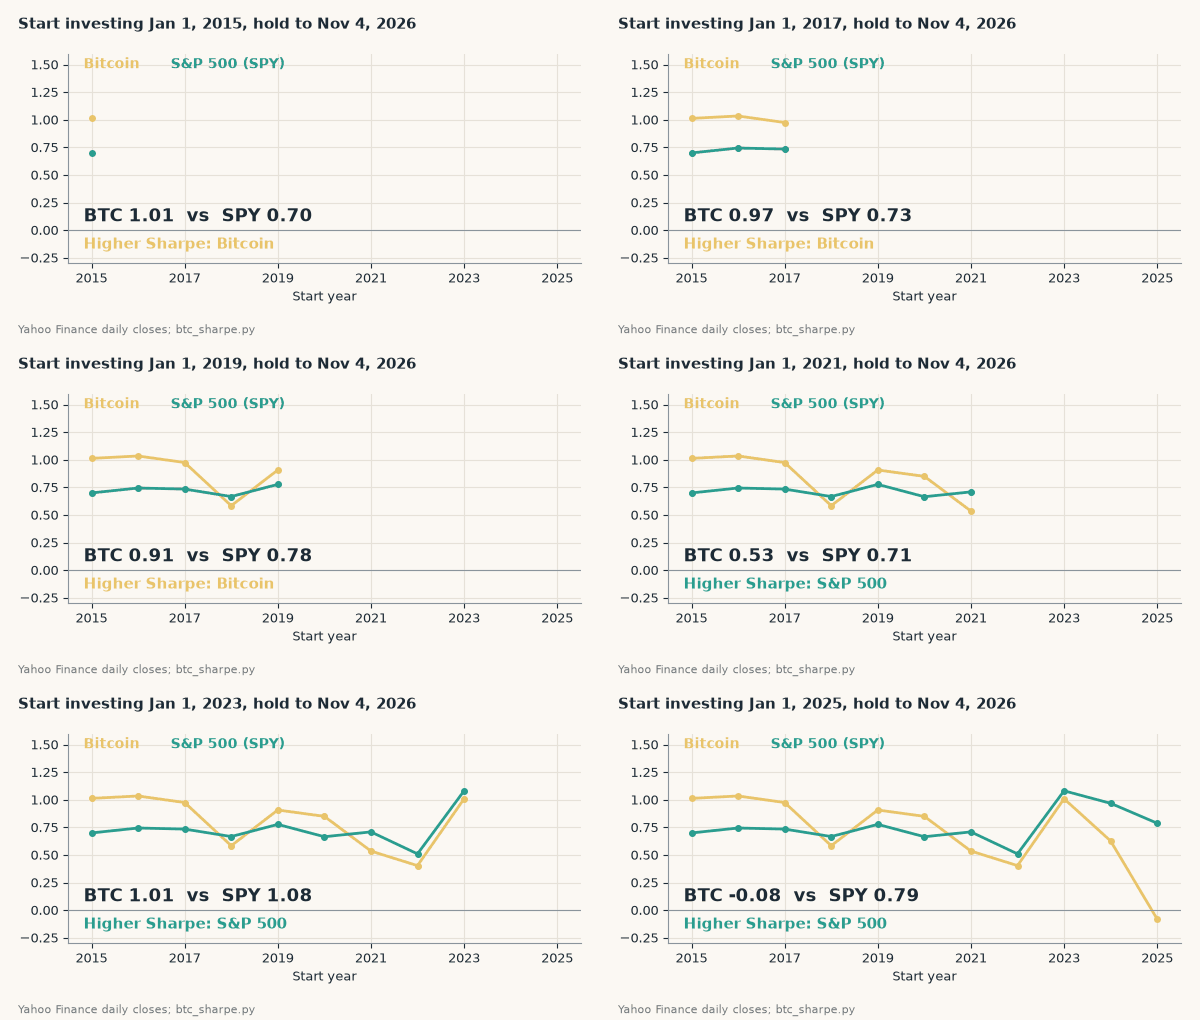
Start in 2015, 2016, 2017, 2019 or 2020 and Bitcoin wins (1.01 vs 0.70 from 2015, 0.85 vs 0.66 from 2020). Start in 2018, just after the 2017 peak, and SPY wins 0.67 to 0.58. Start in any year from 2021 to 2025 and SPY wins every time: 0.71 vs 0.53 from 2021, 0.97 vs 0.63 from 2024, and 0.79 vs −0.08 from January 2025.
Calendar years show the same pattern:
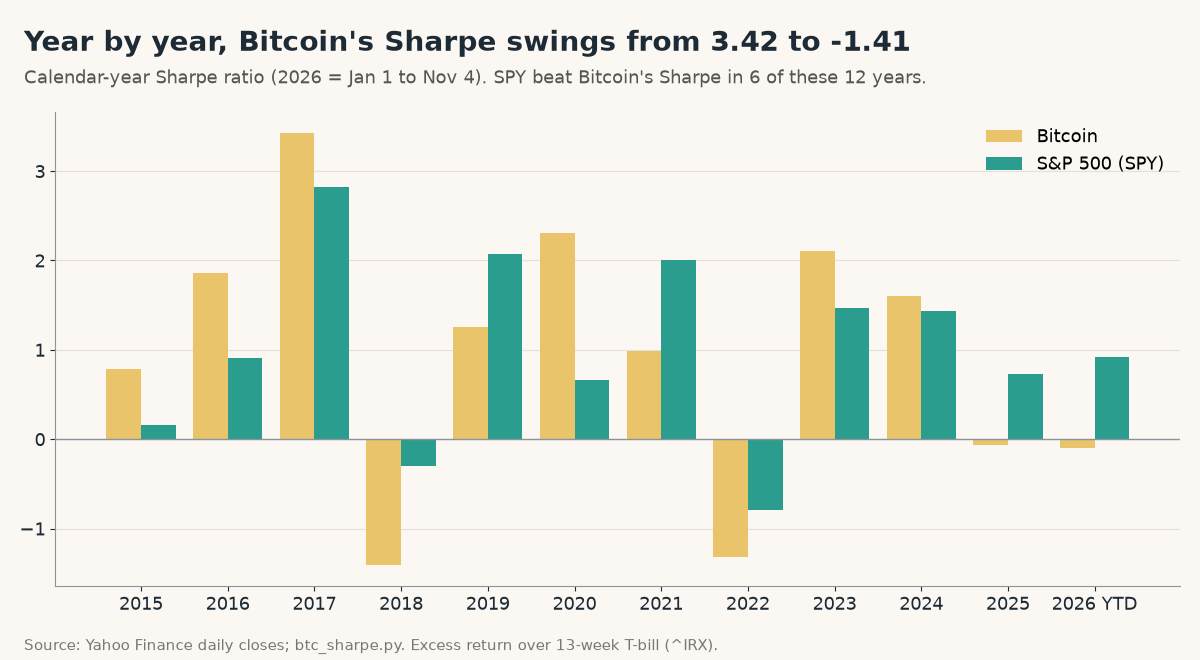
Bitcoin’s best year (2017: +1,424.7%, Sharpe 3.42) and worst years (2018: −74.5%, −1.41; 2022: −64.1%, −1.32) are both extreme. SPY had the higher Sharpe in 6 of the 12 years from 2015 to 2026 YTD, including 2025 (0.73 vs −0.07) and 2026 so far (0.92 vs −0.10).
The √365 vs √252 mistake that skews Bitcoin’s Sharpe
Bitcoin trades 7 days a week and stocks trade about 252 days a year. If you compute Bitcoin’s Sharpe from its calendar-day returns, you have to annualize with √365. Mixing the two is a common spreadsheet error:
Match the annualization factor to the data. On Bitcoin’s 4,431 calendar-day returns, the correct √365 gives a Sharpe of 0.95. Using the stock-market √252 on the same returns gives 0.79, about 17% too low. Using √365 on returns sampled only on trading days would overstate it. Check which one any Bitcoin Sharpe you read is using.
Aligning both assets on SPY trading days sidesteps the problem. Both series then have the same number of observations per year, the same risk-free accrual, and the same √252, so the 0.95 here matches the 0.95 from Bitcoin’s own 7-day returns annualized correctly.
Does a small Bitcoin sleeve raise portfolio Sharpe?
Correlation decides this. Bitcoin’s daily correlation with SPY was 0.23 over the full period and 0.38 since 2020. Low correlation means a small Bitcoin sleeve adds return without adding much volatility. I tested Bitcoin weights from 0% to 20%, with the rest in SPY, rebalanced every quarter end:
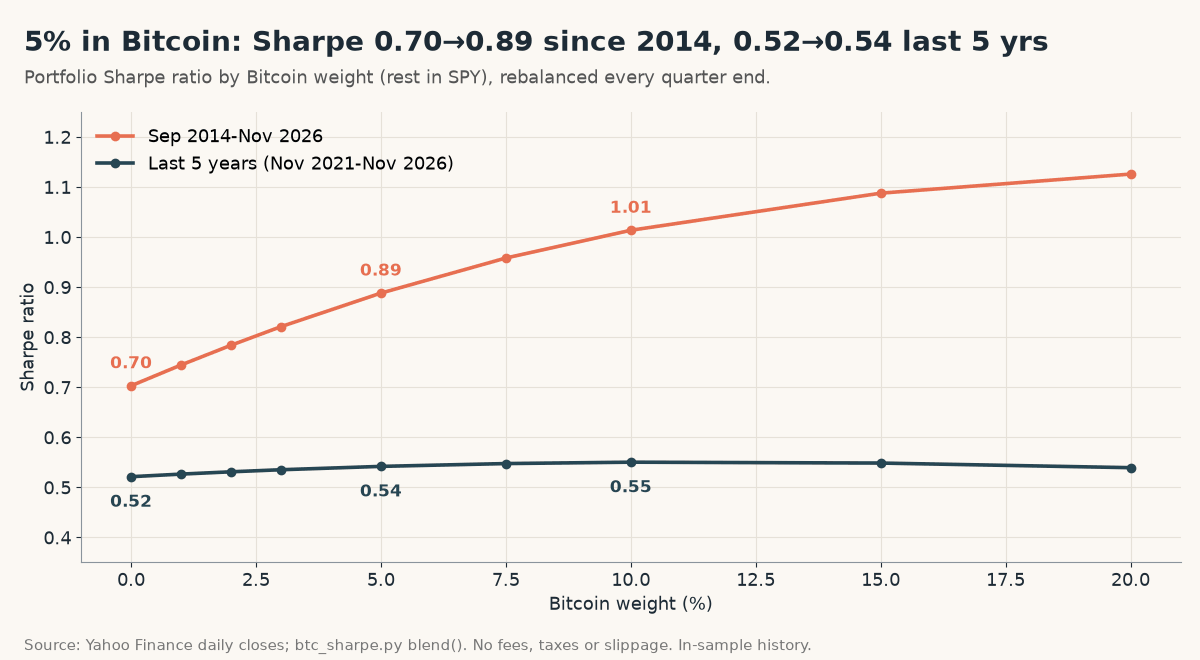
Since 2014, a 5% Bitcoin sleeve lifted the Sharpe ratio from 0.70 to 0.89, compound return from 13.60% to 17.59%, and volatility only from 17.4% to 17.7%. Max drawdown barely moved (−33.7% to −33.9%). But that’s hindsight on a window that includes 2015–2017. Over the last five years the same 5% sleeve moved Sharpe only from 0.52 to 0.54, and it made the worst drawdown deeper (−24.5% to −26.3%). A 10% sleeve reached 0.55 with a −28.8% drawdown. Quarterly rebalancing does matter here: it sells Bitcoin after big runs. For the trade-offs, see how often to rebalance a portfolio.
The Python script (17 lines, reproducible)
The core calculation fits in one short script. It downloads the three series, aligns them, subtracts the T-bill rate and prints the Sharpe ratio for each window:
# Bitcoin vs S&P 500 Sharpe ratio (pip install yfinance pandas numpy)
import numpy as np, pandas as pd, yfinance as yf

px = yf.download(["BTC-USD", "SPY", "^IRX"], start="2014-09-17", end="2026-11-05",
                 auto_adjust=True, progress=False)["Close"]
px = px.dropna(subset=["SPY"]).ffill()          # align on SPY trading days
rets = px[["BTC-USD", "SPY"]].pct_change().dropna()
rf = (px["^IRX"] / 100 / 252).shift(1).reindex(rets.index)   # T-bill, per day

def sharpe(r, rf, n=252):
    ex = r - rf
    return ex.mean() / ex.std() * np.sqrt(n)

for years in (None, 10, 5, 3, 1):
    m = rets.index > rets.index[-1] - pd.DateOffset(years=years) if years else slice(None)
    row = {a: sharpe(rets.loc[m, a], rf[m]) for a in rets}
    print(f"{(str(years) + "y") if years else "all":>3}  BTC {row['BTC-USD']:5.2f}   SPY {row['SPY']:5.2f}")
Output on November 5, 2026:
all  BTC  0.95   SPY  0.70
10y  BTC  1.01   SPY  0.77
 5y  BTC  0.29   SPY  0.52
 3y  BTC  0.74   SPY  1.12
 1y  BTC -0.41   SPY  0.85
The full version (btc_sharpe.py, with Sortino, drawdown, the rolling windows and the rebalanced blends) just adds more print lines on top of this. Two caveats: Yahoo’s data revises from time to time, and your numbers will drift as new days come in. That’s expected, since every Sharpe ratio is a snapshot. If you’re new to Bitcoin data, Finxter’s Bitcoin cheat sheets are a good primer.
How to check this on your own portfolio
A real portfolio has deposits, withdrawals and trades on different dates, so a two-ticker script won’t fit it. Walk through comparing your portfolio to the S&P 500 to get the cash-flow-adjusted method. If you’d rather not code it, PortfolioTracker24 is a free browser tracker for stocks and ETFs that keeps your data in your browser (no account, no broker connection), saves Excel backups, and compares your trades with what the same money would have done in the S&P 500 and in Bitcoin, plus Sharpe, Sortino and drawdown readings from your saved price snapshots. For more free options, see Finxter’s roundup of free portfolio trackers. To stress-test the downside, the 60/40 portfolio max drawdown analysis shows what a bond sleeve does in crashes.
| Question | What the data says (Sep 2014 to Nov 4, 2026) | What to do |
|---|---|---|
| Higher Sharpe overall? | Bitcoin 0.95 vs SPY 0.70 | Treat it as a hindsight result tied to 2014–2017 |
| Higher Sharpe recently? | SPY: 0.52 vs 0.29 (5 y), 1.12 vs 0.74 (3 y), 0.85 vs −0.41 (1 y) | Quote the window with every Sharpe number |
| How stable is the lead? | BTC ahead in 58% of rolling 1-year windows, 46% since 2021 | Look at rolling Sharpe, not one number |
| Annualization? | BTC 7-day returns: 0.95 with √365, 0.79 with √252 | Match the factor to the return frequency |
| Small BTC sleeve? | 5%: 0.70 → 0.89 since 2014, 0.52 → 0.54 last 5 years | Size it for the drawdown (−83% worst), not the ratio |
Limits of this analysis: it’s history, not a forecast. There are no fees, taxes, spreads or custody costs, which hit Bitcoin harder. Sharpe assumes returns are roughly symmetric, and Bitcoin’s aren’t. The 2014 start date is set by Yahoo’s data, not chosen to flatter either side. And Bitcoin’s 2014–2017 era may not repeat.
FAQ
Does Bitcoin have a higher Sharpe ratio than the S&P 500?
Over the full record from September 2014 to November 4, 2026, yes: 0.95 vs 0.70 for SPY. Over the last 5 years, no: SPY leads 0.52 to 0.29, and it also leads over 3 years and 1 year. The answer depends on the window.
What is the Sharpe ratio of Bitcoin?
Measured against 13-week T-bills, Bitcoin's Sharpe ratio was 0.95 from September 2014 to November 4, 2026, 1.01 over 10 years, 0.29 over 5 years, 0.74 over 3 years and −0.41 over the last 12 months.
What is a good Sharpe ratio?
There is no official cutoff. Many investors treat values above 1 as good over long periods. For context, SPY, a broad S&P 500 fund, scored 0.70 from 2014 to 2026 and 0.52 over the last five years.
Should you use 252 or 365 days to annualize Bitcoin's Sharpe ratio?
Use the factor that matches your data. Bitcoin's 7-day calendar returns need √365 (Sharpe 0.95 here). Applying √252 to them gives 0.79. If you align Bitcoin to stock trading days, √252 is correct.
Does adding Bitcoin to a portfolio improve the Sharpe ratio?
Historically, a little Bitcoin helped. A 5% sleeve, rebalanced quarterly, lifted SPY's Sharpe from 0.70 to 0.89 since 2014. Over the last five years the gain shrank to 0.52 → 0.54, with a deeper drawdown.
How correlated is Bitcoin with the S&P 500?
Daily returns had a correlation of 0.23 from 2014 to November 2026 and 0.38 since 2020. Both are low to moderate, which is why a small Bitcoin sleeve barely raises portfolio volatility.
Takeaway
Bitcoin’s Sharpe ratio beats the S&P 500’s on the full 2014–2026 record (0.95 vs 0.70) and loses on every start date from 2021 on. Before you trust any “Bitcoin vs S&P 500” Sharpe chart, check its start date and its annualization factor. If your research notes are turning into something worth sharing, like a short guide to risk-adjusted returns for your readers, ImagineYourBook can draft a 10,000-word first version from your notes. The trial is $0 for 7 days with a card on file and one complete 10,000-word book; after that it’s $24.99/month on the Author plan unless you cancel before day 8. Fact-check every figure before you publish.
Sources (checked November 5, 2026): William F. Sharpe, The Sharpe Ratio (1994) · Yahoo Finance: BTC-USD history · Yahoo Finance: SPY history · Yahoo Finance: 13-week T-bill (^IRX) · yfinance on GitHub · ImagineYourBook pricing and trial terms. Script: btc_sharpe.py (core shown above). Not investment advice.