
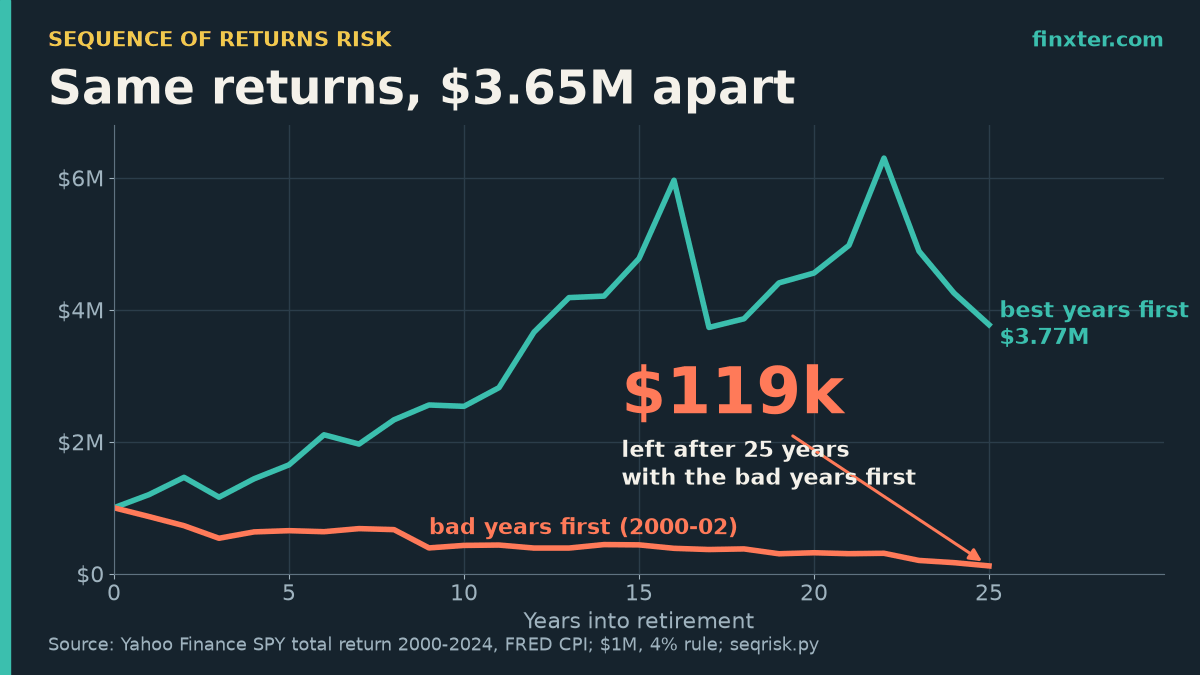
Here is a sequence of returns risk example with real numbers: take SPY’s 25 calendar-year total returns from 2000 to 2024, retire with $1,000,000, and withdraw 4% a year with inflation raises. Retire into those years in their real order and you end with $119,235. Run the exact same 25 returns backwards and you end with $3,773,727.
Same average. Same compound return (7.61% a year). Same $1,342,287 withdrawn. A $3.65 million difference that comes only from the order of the years.
That’s sequence of returns risk: when money is flowing out, losses that hit early do far more damage than the same losses late. Below you’ll see the data, three charts, an animation, a test across 13 different retirement start years, one cheap fix, and the short Python script that produced every number.
TL;DR
- Same 25 SPY years (2000–2024, 7.61%/yr), $1M, 4% rule: real order ends at $119,235, reversed order at $3,773,727.
- Both withdrew the same $1,342,287. With no withdrawals, both end at $6,260,930: order only matters when money flows out.
- Retiring in 1999 (5.51% CAGR) beat retiring in 2000 (5.97% CAGR): $647,015 vs $318,300 after 20 years.
- Skipping the inflation raise after each of six losing years lifted the 2000 retiree’s ending balance to $677,335.
- Short Python script included, built on Yahoo Finance and FRED data.
If you build tools or write about money, this kind of worked example is also great raw material for a guide. ImagineYourBook is an AI book-writing tool that turns your notes into a complete, editable draft (a 10,000-word book on the free trial) with Word and EPUB export, useful if you want to turn your retirement-planning knowledge into a client guide or lead-magnet ebook.
The setup: one data set, two orders
The data is SPY’s adjusted close from Yahoo Finance (dividends reinvested), turned into calendar-year returns, plus December-to-December CPI inflation from FRED. The assumptions are deliberately simple, and they’re assumptions, not advice:
- $1,000,000 starting balance, 100% in SPY.
- 4% rule: withdraw $40,000 at the start of year one, then raise the withdrawal by last year’s CPI inflation every year.
- No fees, no taxes, no rebalancing.
The forward retiree retires in January 2000. Their first three years are −9.7%, −11.8% and −21.6%, the dot-com bust. The reversed retiree gets 2024 first, so their first three years are +24.9%, +26.2% and −18.2%.
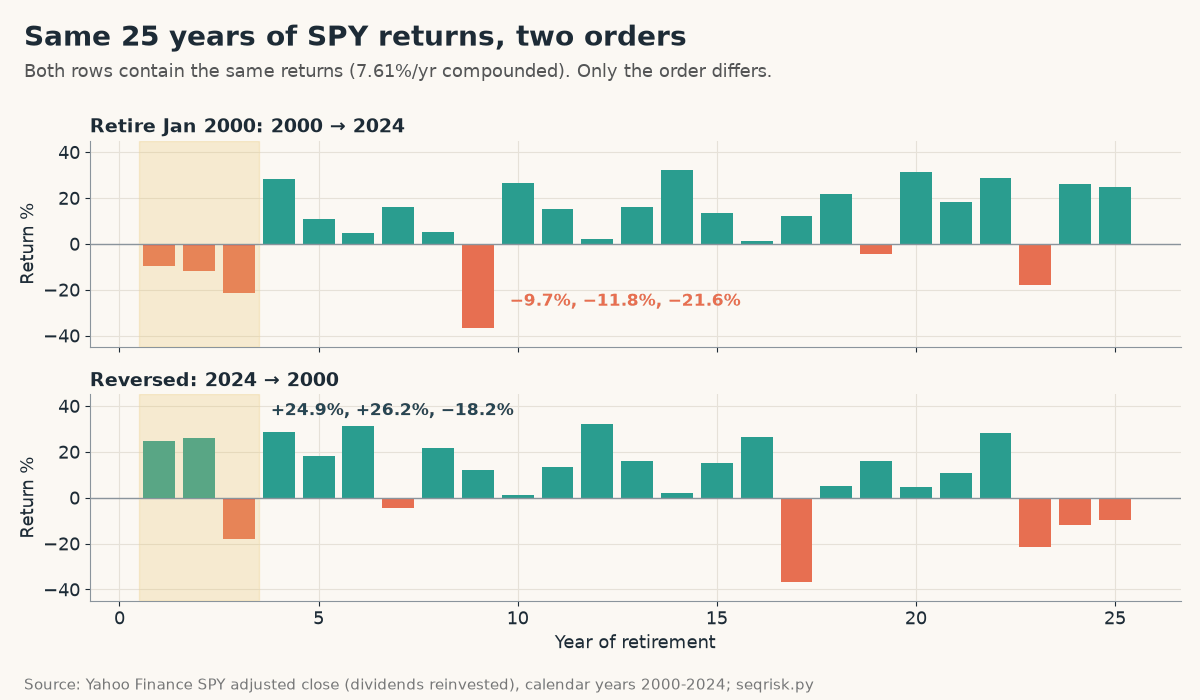
Without withdrawals, the order doesn’t matter at all. $1,000,000 grows to exactly $6,260,930 either way, because multiplication doesn’t care about order. The withdrawals are what break the symmetry.
The result: $119,235 vs $3,773,727
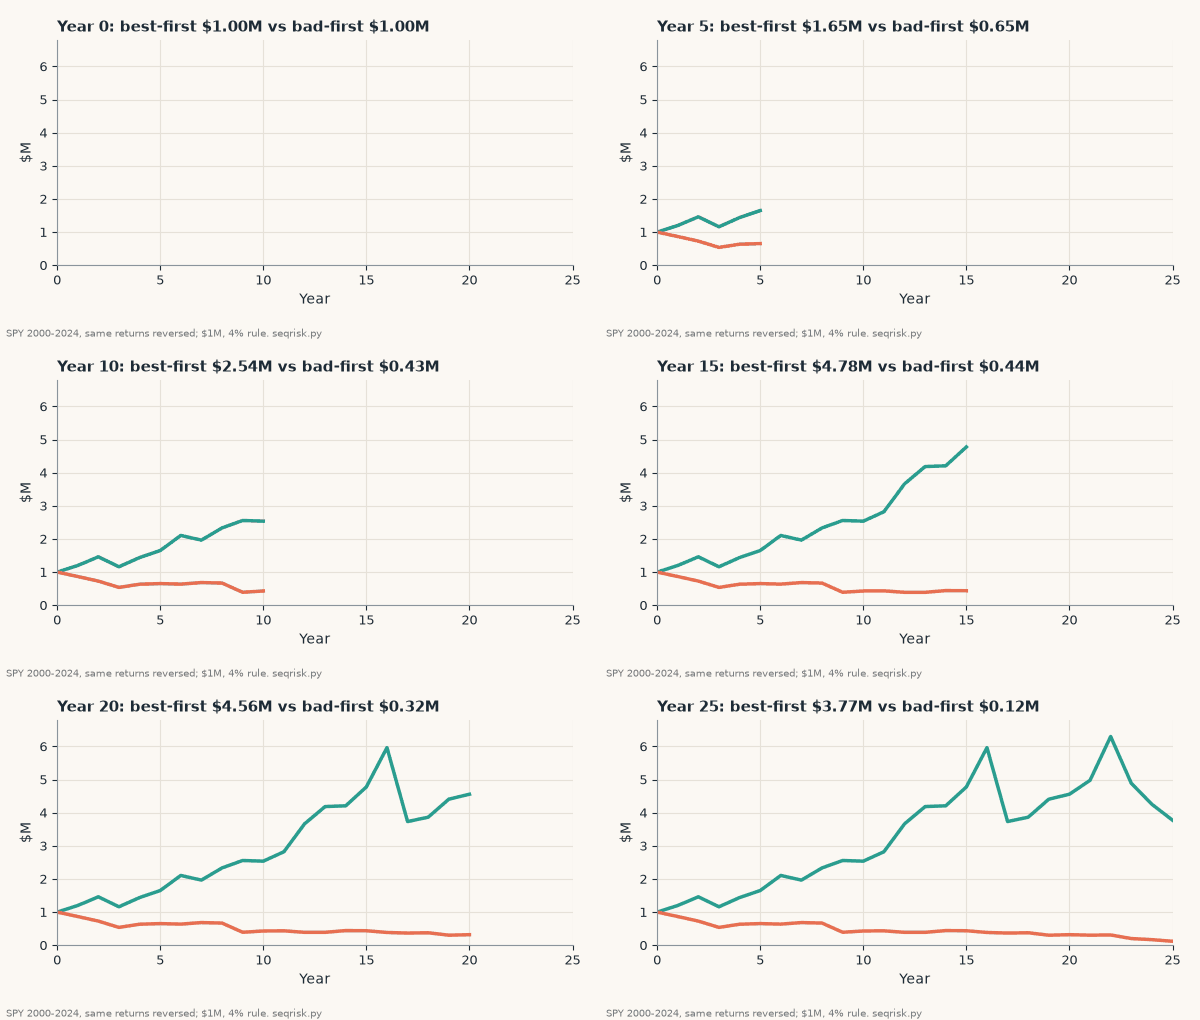
After just three years, the forward retiree is down to $537,830 while the reversed retiree has $1,160,626. From there, the forward retiree is pulling a rising, inflation-adjusted check (the 25th withdrawal is $72,709) out of a balance that never gets back to $1 million. The reversed retiree’s portfolio peaks above $6.2 million before the bad years finally show up, and by then there’s plenty of cushion to absorb them.
| Retire Jan 2000 (real order) | Same returns reversed | |
|---|---|---|
| First three years | −9.7%, −11.8%, −21.6% | +24.9%, +26.2%, −18.2% |
| Balance after 3 years | $537,830 | $1,160,626 |
| Total withdrawn (25 yrs) | $1,342,287 | $1,342,287 |
| Balance after 25 years | $119,235 | $3,773,727 |
| Without withdrawals | $6,260,930 | $6,260,930 |
Both retirees took out exactly the same $1,342,287. Neither ran out of money within 25 years. But one ends with a balance that covers less than two years of spending and the other ends richer than they started.
Morningstar’s retirement researchers describe the same effect in their State of Retirement Income work: in their simulations, nearly 70% of the retirement “failures” were trials where the portfolio had lost value by the end of year five. Our 2000 retiree lost 46% of their starting balance in the first three years.
It isn’t the average return. It’s the first few years
The cleanest way to prove that sequence risk isn’t just “bad returns” is to compare real retirement start years. I ran the same 4% rule over every 20-year window the SPY data allows, from a 1994 start to a 2006 start (each ending by 2025).
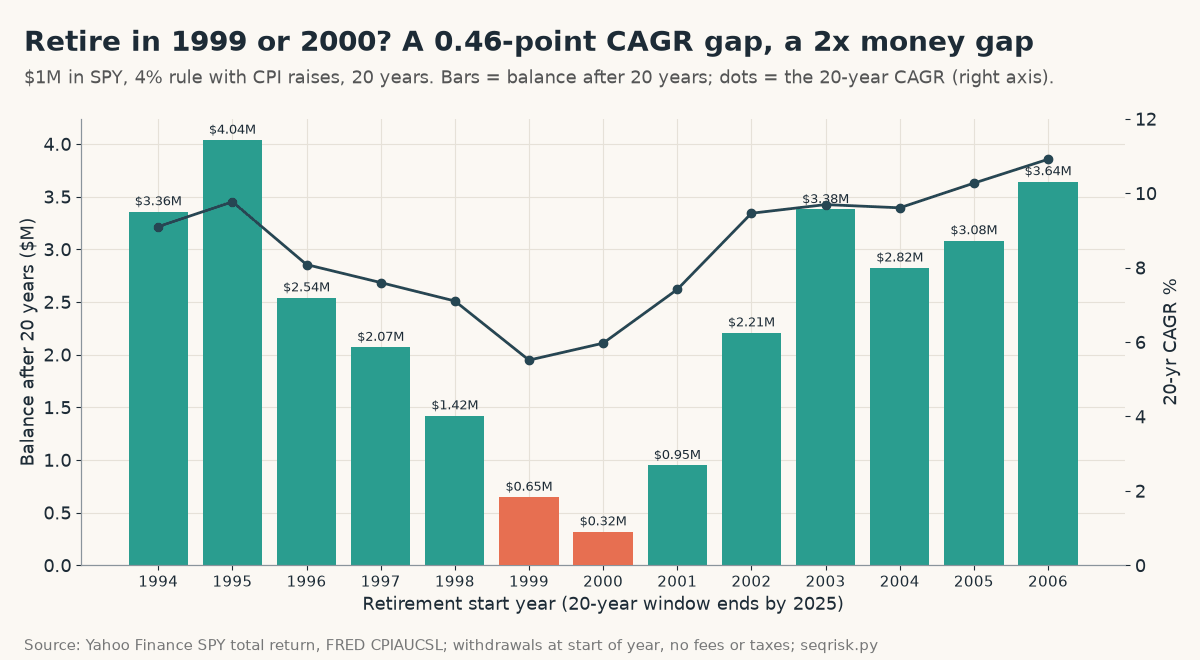
Look at 1999 and 2000. A retiree starting in 1999 earned a lower 20-year compound return (5.51%) than one starting in 2000 (5.97%). Yet the 1999 retiree ended with $647,015 and the 2000 retiree with $318,300, about half as much.
Why? The 1999 retiree banked SPY’s strong 1999 before the crash, so their first three years combined were only −4.1%. The 2000 retiree’s first three years combined were −37.5%. Higher average return, worse order, half the money.
The rest of the chart tells the same story. The 2006 retiree hit the 2008 crash in year three (first three years −23.0%), but the 20-year CAGR of 10.91% was strong enough to end at $3,643,183. Bad years early hurt; very bad years early, with only a middling recovery, is where plans break.
| Start year | First 3 years combined | 20-year CAGR | Balance after 20 years |
|---|---|---|---|
| 1994 | +69.8% | 9.10% | $3,357,508 |
| 1995 | +125.7% | 9.77% | $4,037,107 |
| 1996 | +110.4% | 8.08% | $2,540,089 |
| 1997 | +106.8% | 7.60% | $2,070,276 |
| 1998 | +39.8% | 7.10% | $1,420,040 |
| 1999 | -4.1% | 5.51% | $647,015 |
| 2000 | -37.5% | 5.97% | $318,300 |
| 2001 | -11.3% | 7.41% | $948,356 |
| 2002 | +11.3% | 9.46% | $2,207,638 |
| 2003 | +48.7% | 9.69% | $3,377,857 |
| 2004 | +34.4% | 9.61% | $2,823,689 |
| 2005 | +27.7% | 10.27% | $3,082,371 |
| 2006 | -23.0% | 10.91% | $3,643,183 |
A cheap fix: skip the raise after losing years
Charles Schwab’s guidance on sequence risk lists two practical defenses: keep a cash and short-term bond reserve for the next few years of spending (they suggest about one year in cash and two to four years in short-term bonds), and, if you didn’t prepare, spend less after bad years, for example by giving up inflation adjustments.
I tested the second idea on the unlucky 2000 retiree. The only change: in the year after a losing year, don’t raise the withdrawal for inflation. In 2000 to 2024 that happened six times (after 2000, 2001, 2002, 2008, 2018 and 2022).
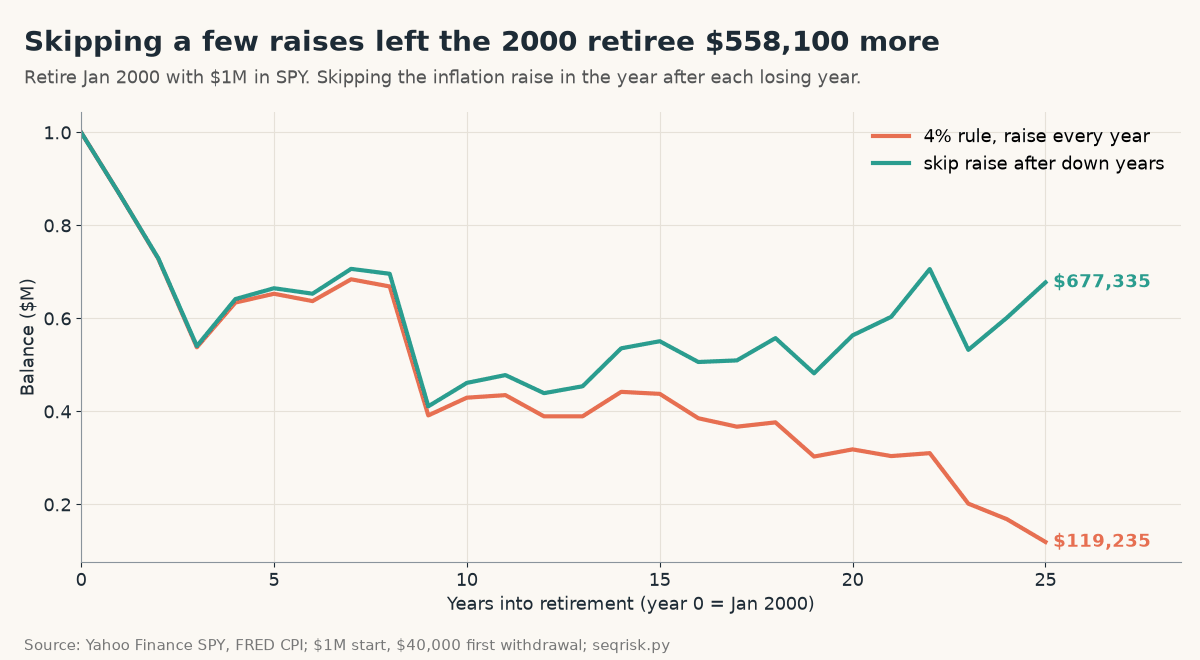
That small rule cut total withdrawals from $1,342,287 to $1,199,514 (about $142,773 less over 25 years) and lifted the ending balance from $119,235 to $677,335, a $558,100 improvement. Each skipped raise stays skipped, so spending power drops for good; the trade is a slightly smaller check for a much bigger safety margin.
The rule to remember: sequence risk only exists when money moves. With no withdrawals, both orders end at the same $6,260,930. It’s the first few years of withdrawals during a crash that sell shares at low prices, so those years deserve the most protection.
The Python script
This is the full script behind every number above. It needs pandas, a SPY price file from yfinance (yf.download("SPY", start="1993-01-01", auto_adjust=True) saved as a pickle) and FRED’s CPIAUCSL CSV.
"""Sequence of returns risk example: same 25 SPY years, two orders.
Data: Yahoo Finance SPY adjusted close (yfinance), FRED CPIAUCSL. Assumptions: 100% SPY,
$1,000,000 start, 4% rule ($40,000 in year 1, raised by Dec-to-Dec CPI), withdrawal at start of year, no fees/taxes."""
import pandas as pd

def annual_returns(pkl="src/spy.pkl"):
    px = pd.read_pickle(pkl)["Close"].squeeze()
    ye = px.groupby(px.index.year).last()          # year-end adjusted close
    return ye.pct_change().dropna()                 # calendar-year total return

def cpi_inflation(csv="src/CPIAUCSL.csv"):
    c = pd.read_csv(csv, index_col=0, parse_dates=True).squeeze()
    dec = c[c.index.month == 12]; dec.index = dec.index.year
    return dec.pct_change().dropna()

def simulate(rets, infl, start=1_000_000, rate=0.04, freeze=False):
    """freeze=True: skip the inflation raise in the year after a losing year (a Schwab-style spending fix)."""
    bal, w, path, total = start, start * rate, [start], 0.0
    for r, i in zip(rets, infl):
        take = min(w, bal); bal = (bal - take) * (1 + r); total += take
        path.append(bal); w *= 1 if (freeze and r < 0) else 1 + i
    return path, total

if __name__ == "__main__":
    R, I = annual_returns(), cpi_inflation()
    yrs = list(range(2000, 2025)); r = R.loc[yrs].values; inf = I.loc[[y - 1 for y in yrs]].values  # year-1 raise uses prior Dec-Dec CPI
    cagr = ((1 + R.loc[yrs]).prod()) ** (1 / 25) - 1
    print(f"SPY 2000-2024: CAGR {cagr:.2%}, first 3 years {r[0]:+.1%} {r[1]:+.1%} {r[2]:+.1%}, last 3 {r[-3]:+.1%} {r[-2]:+.1%} {r[-1]:+.1%}")
    nw_f, _ = simulate(r, inf, rate=0); nw_b, _ = simulate(r[::-1], inf, rate=0)
    print(f"no withdrawals: forward ${nw_f[-1]:,.0f}  reversed ${nw_b[-1]:,.0f}")
    f, tf = simulate(r, inf); b, tb = simulate(r[::-1], inf)
    print(f"4% rule forward (retire Jan 2000): end ${f[-1]:,.0f}, withdrawn ${tf:,.0f}, low ${min(f):,.0f}")
    print(f"4% rule reversed (best years first): end ${b[-1]:,.0f}, withdrawn ${tb:,.0f}")
    fz, tz = simulate(r, inf, freeze=True)
    print(f"forward + freeze raise after down years: end ${fz[-1]:,.0f}, withdrawn ${tz:,.0f}")
    print(f"after 3 years: forward ${f[3]:,.0f}  reversed ${b[3]:,.0f}")
    print(f"year-25 withdrawal ${40000*(1+inf[:-1]).prod():,.0f}")
    print("start-year table (20-year windows, ends 2025):")
    for s in range(1994, 2007):
        ys = list(range(s, s + 20)); p, t = simulate(R.loc[ys].values, I.loc[[y - 1 for y in ys]].values)
        c = (1 + R.loc[ys]).prod() ** (1 / 20) - 1
        print(f"  {s}: CAGR {c:.2%}  end ${p[-1]:,.0f}  first3 {(1+R.loc[ys[:3]]).prod()-1:+.1%}")
Output:
SPY 2000-2024: CAGR 7.61%, first 3 years -9.7% -11.8% -21.6%, last 3 -18.2% +26.2% +24.9%
no withdrawals: forward $6,260,930  reversed $6,260,930
4% rule forward (retire Jan 2000): end $119,235, withdrawn $1,342,287, low $119,235
4% rule reversed (best years first): end $3,773,727, withdrawn $1,342,287
forward + freeze raise after down years: end $677,335, withdrawn $1,199,514
after 3 years: forward $537,830  reversed $1,160,626
year-25 withdrawal $72,709
start-year table (20-year windows, ends 2025):
  1994: CAGR 9.10%  end $3,357,508  first3 +69.8%
  1995: CAGR 9.77%  end $4,037,107  first3 +125.7%
  1996: CAGR 8.08%  end $2,540,089  first3 +110.4%
  1997: CAGR 7.60%  end $2,070,276  first3 +106.8%
  1998: CAGR 7.10%  end $1,420,040  first3 +39.8%
  1999: CAGR 5.51%  end $647,015  first3 -4.1%
  2000: CAGR 5.97%  end $318,300  first3 -37.5%
  2001: CAGR 7.41%  end $948,356  first3 -11.3%
  2002: CAGR 9.46%  end $2,207,638  first3 +11.3%
  2003: CAGR 9.69%  end $3,377,857  first3 +48.7%
  2004: CAGR 9.61%  end $2,823,689  first3 +34.4%
  2005: CAGR 10.27%  end $3,082,371  first3 +27.7%
  2006: CAGR 10.91%  end $3,643,183  first3 -23.0%
To try your own numbers, change start, rate, or the year list, or pass freeze=True. If you want to see how your actual holdings have done against the S&P 500 without uploading them anywhere, PortfolioTracker24 is a free tracker that runs in your browser, needs no account or broker connection, and keeps Excel backups.
What this example doesn’t show
- It’s one asset. 100% SPY is the case Morningstar flags as most exposed to sequence risk. A stock-bond mix falls less in a crash; see Finxter’s 60/40 portfolio max drawdown analysis for how much less.
- History isn’t a forecast. The reversed order is a thought experiment, not a scenario anyone lived.
- Real life has taxes, fees, and flexible spending. Most retirees cut back after a crash anyway, which is exactly why the freeze test matters.
For the flip side of the same coin, read missing the best days in the market (the biggest up-days come right after the worst ones) and how long it takes the stock market to recover from a crash. If you’re still in the saving phase, lump sum vs DCA covers the order-of-returns question for money going in.
FAQ
What is a simple example of sequence of returns risk?
Take SPY's 2000–2024 returns, $1M and a 4% inflation-adjusted withdrawal. In real order (crash first) the portfolio ends at $119,235. Reverse the same 25 returns and it ends at $3,773,727, even though both withdrew $1,342,287.
Does sequence of returns risk matter if I'm not withdrawing?
No. With no withdrawals, the same returns in any order give the same result: $1M grows to $6,260,930 either way in this example. Sequence risk appears when money flows in or out.
How many years of retirement does sequence risk affect most?
The first few. Morningstar found nearly 70% of failed retirement simulations had lost value by the end of year five. In this example the 2000 retiree was down 46% after three years.
Is a higher average return always safer?
No. Retiring in 1999 earned a lower 20-year CAGR (5.51%) than retiring in 2000 (5.97%), yet ended with $647,015 versus $318,300, because its first three years were −4.1% combined instead of −37.5%.
How can I reduce sequence of returns risk?
Schwab suggests holding about a year of spending in cash and two to four years in short-term bonds, and spending less after bad years. Skipping the inflation raise after losing years lifted our 2000 retiree's ending balance from $119,235 to $677,335.
The takeaway
Sequence of returns risk turns the same 7.61% a year into either $119,235 or $3.77 million, depending only on which years come first. You can’t choose your first five years of retirement, but you can plan for them: hold a few years of spending outside stocks, and be ready to skip a raise after a losing year.
And if you’ve built a model like this, consider writing it up. ImagineYourBook can turn your notes into a full draft of a retirement-planning guide or lead-magnet ebook that you then edit and publish. The free trial includes one 10,000-word book; a card is required, and the $24.99 Author plan starts after 7 days unless you cancel before day 8.
Sources (checked November 9, 2026): Yahoo Finance: SPY history · yfinance on GitHub · FRED: CPIAUCSL consumer price index · Morningstar: The biggest risk for new retirees · Charles Schwab: What is sequence-of-returns risk? · ImagineYourBook pricing and trial terms. Script: seqrisk.py (shown above). Not investment advice.