
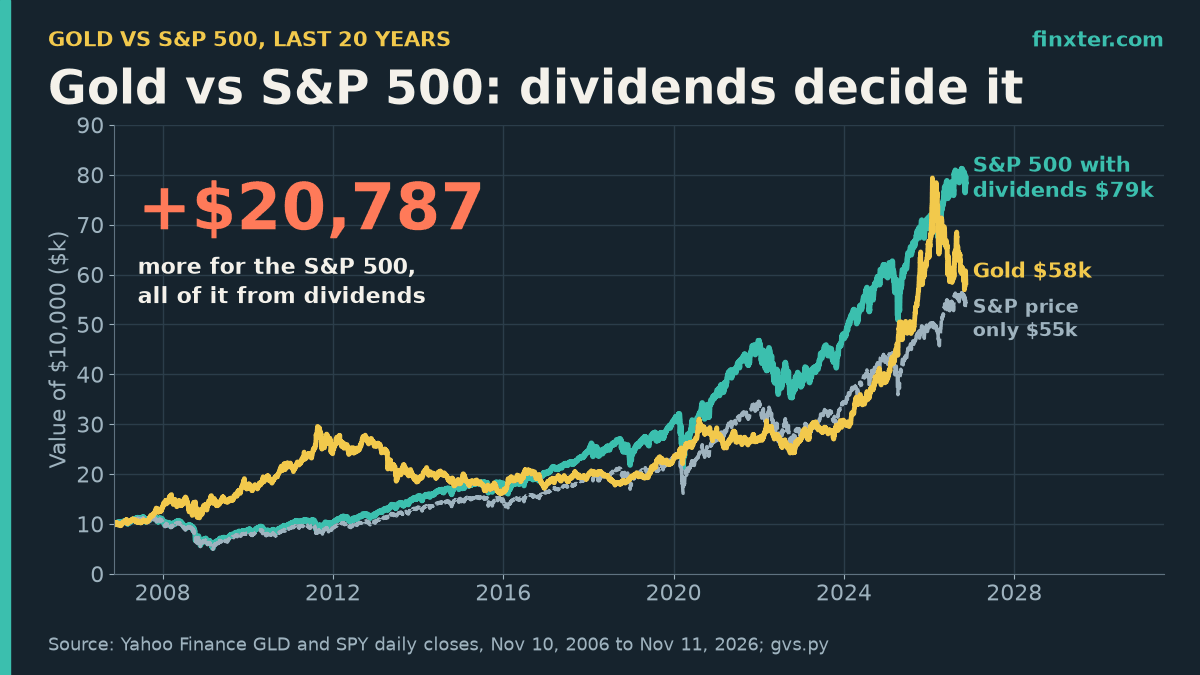
Short answer: over the last 20 years, the S&P 500 beat gold. From November 10, 2006 to November 11, 2026, $10,000 in the S&P 500 ETF (SPY) with dividends reinvested grew to $79,224, or 10.90% a year. The same $10,000 in the gold ETF (GLD) grew to $58,437, or 9.23% a year.
But the gap is smaller and stranger than most “gold vs S&P 500 last 20 years” charts suggest. Those charts usually plot price only. On price alone, the S&P 500 turned $10,000 into just $54,963 and lost to gold. Dividends alone decided the race. And as recently as April 7, 2026, gold was still ahead.
I pulled 22 years of daily GLD and SPY prices with Python and ran the numbers every way a real investor would ask: by start date, by holding period, by worst crash, after inflation, and as a 10-30% slice of a stock portfolio. Everything below comes from that data, and the full script is at the end.
TL;DR
- Last 20 years (Nov 2006 to Nov 2026): $10,000 in the S&P 500 with dividends became $79,224 (10.90%/yr). In gold (GLD) it became $58,437 (9.23%/yr).
- Price only, the S&P 500 reached just $54,963 and lost to gold. Dividends decided the race.
- Gold led until April 7, 2026, after a +63.7% year in 2025. It is now 26.4% below its January 2026 peak.
- Over rolling 10-year holds since 2004, gold beat the S&P 500 only 13% of the time. It sat 8.9 years underwater after 2011.
- An 80/20 S&P 500/gold mix beat both ($80,749) with a smaller worst drawdown (-43.6% vs -55.2%). Python script included.
Side note for readers who publish: if you turn analysis like this into a finance ebook or a lead magnet for your newsletter, ImagineYourBook is an AI book-writing tool that turns a prompt or your notes into a complete draft (a 10,000-word book in the free trial) with a cover, exported as Word and EPUB. You still bring the numbers and the final fact check.
The 20-year scoreboard
Here are the two assets side by side over exactly 20 years. Gold is GLD, which tracks the LBMA gold price minus a 0.40% yearly expense ratio and pays no dividends. The S&P 500 is SPY, measured two ways: price only, and with dividends reinvested (Yahoo Finance’s adjusted close).
| Nov 10, 2006 to Nov 11, 2026 | $10,000 grew to | Return per year | Volatility | Worst drawdown |
|---|---|---|---|---|
| S&P 500 (SPY), dividends reinvested | $79,224 | 10.90% | 19.5% | -55.2% |
| Gold (GLD) | $58,437 | 9.23% | 18.2% | -45.6% |
| S&P 500 (SPY), price only | $54,963 | 8.89% | 19.5% | -56.5% |
Three things stand out.
First, dividends are worth about 2 percentage points a year here (10.90% vs 8.89%). Over 20 years that compounds into $24,261 of the S&P’s $79,224. If you want to see that effect in isolation, our dividend reinvestment calculator breaks it down.
Second, gold was not the “safe” asset by every measure. Its volatility (18.2%) was close to stocks (19.5%), and its worst drawdown was -45.6%.
Third, monthly returns of gold and the S&P 500 had a correlation of just +0.09. They mostly move independently, which matters later.
Watch the race play out month by month:
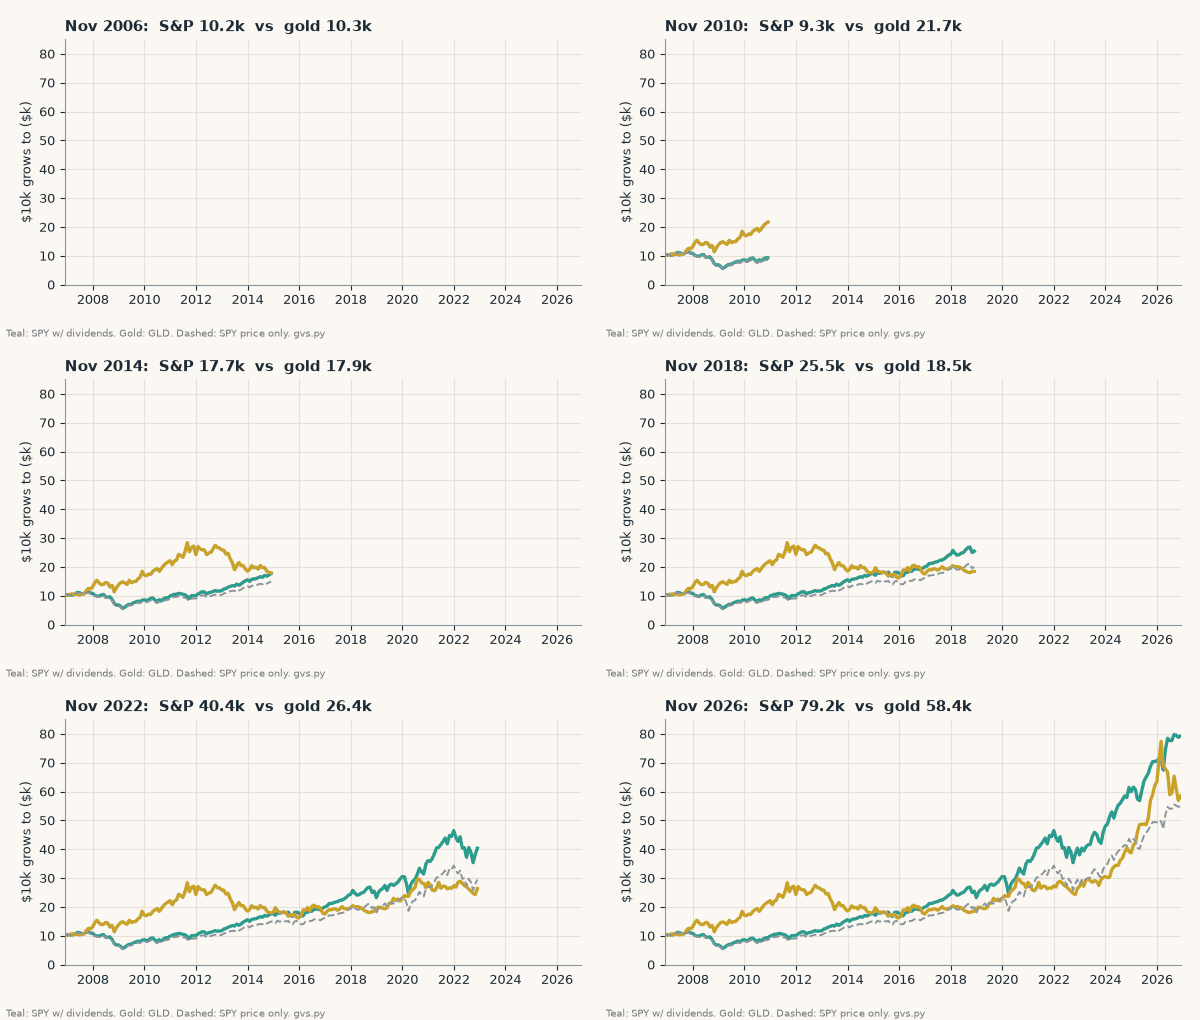
Gold led as recently as April 2026
The 20-year verdict is fragile. Gold’s best calendar year in this period was 2025, at +63.7%. On January 29, 2026, the gold position was worth $79,357 against $71,805 for the S&P 500. Anyone who searched this question in January got the opposite answer.
Since that peak, GLD has fallen 26.4%. The last day gold led was April 7, 2026.
The start date matters even more. Here is the same comparison for the last 5, 10, 15 and 20 years, all ending November 11, 2026:
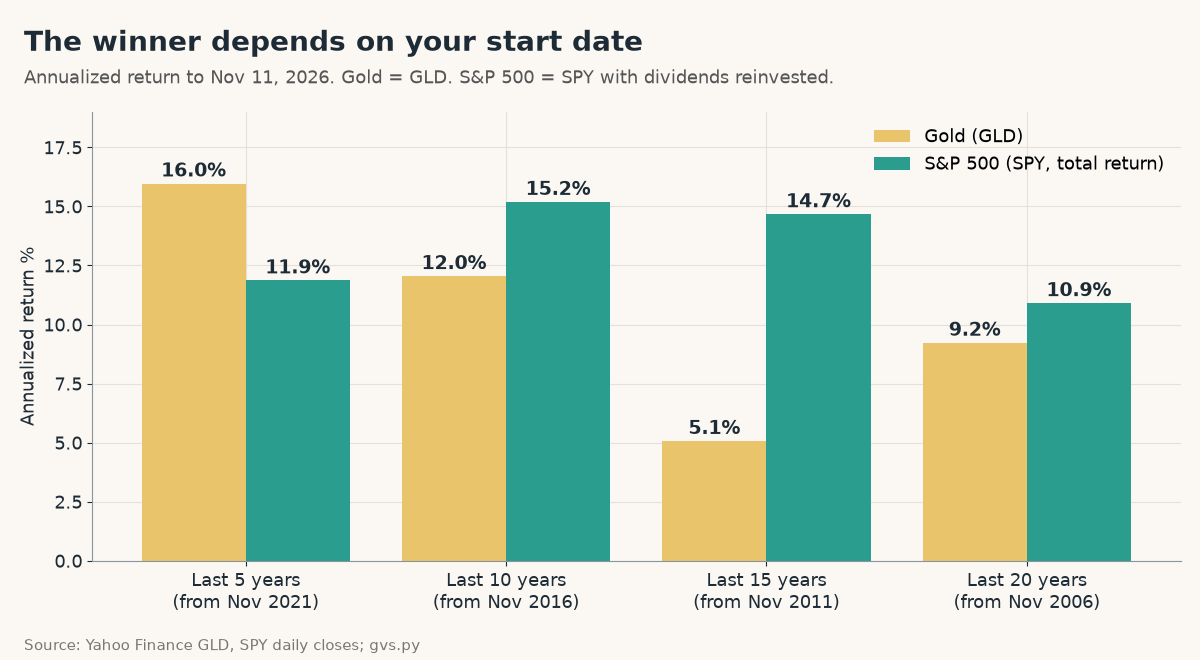
Gold wins the last 5 years (15.97% vs 11.87% a year). The S&P 500 wins the last 10, 15 and 20. The 15-year window is brutal for gold (5.07% vs 14.67%) because it starts in November 2011, a few months after gold’s 2011 high.
So “gold vs S&P 500 over the last N years” mostly measures where gold sat on the start date.
How often does gold actually win?
To remove the start-date luck, I checked every rolling window that starts at a month end since GLD launched in November 2004:
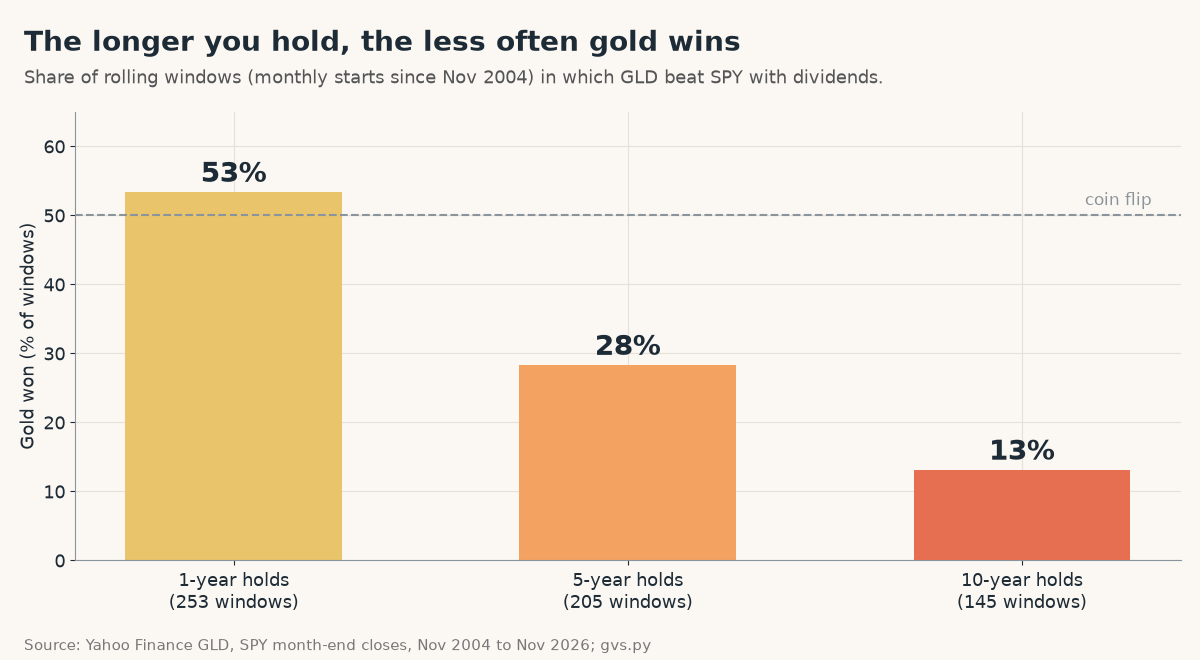
Over 1-year holds, gold beat the S&P 500 (with dividends) 53% of the time, a coin flip. Over 5-year holds that fell to 28%. Over 10-year holds, gold won only 13% of the 145 windows.
That’s the pattern you’d expect when one asset compounds earnings and dividends and the other only compounds price. Short-term, anything can happen. Long-term, the stock market’s extra 2 points of yield add up.
The pain: gold’s 8.9-year drawdown
Returns tell half the story. The other half is how long you sit below your old high:
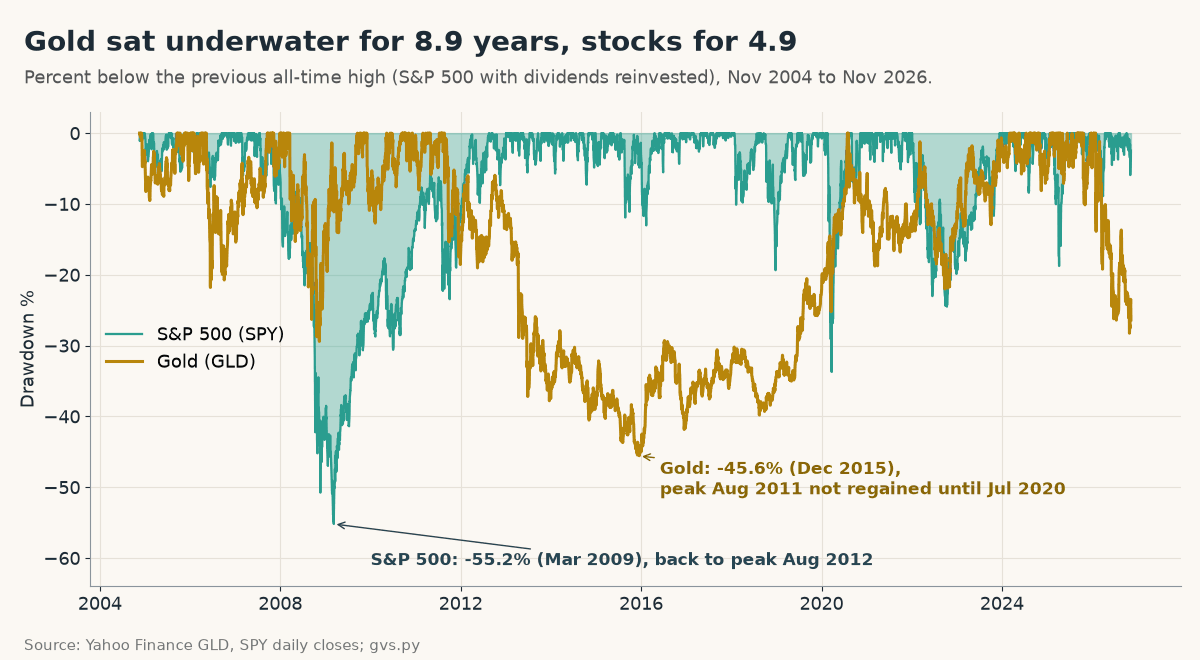
The S&P 500 had the deeper crash: -55.2% by March 2009. But with dividends reinvested it was back to its October 2007 peak by August 2012, 4.9 years later.
Gold’s crash was shallower (-45.6% by December 2015) and lasted far longer. GLD peaked in August 2011 and didn’t get back there until July 2020: 8.9 years underwater. If you bought gold in 2011 “for safety”, you waited almost nine years to break even.
What gold did when stocks fell
This is where gold earns its reputation. In every calendar year since 2007 in which the S&P 500 lost money, gold lost less or gained:
| Year | S&P 500 (SPY, total return) | Gold (GLD) | Gold minus S&P |
|---|---|---|---|
| 2008 | -36.8% | +4.9% | +41.7 pts |
| 2018 | -4.6% | -1.9% | +2.7 pts |
| 2022 | -18.2% | -0.8% | +17.4 pts |
In 2008 the gap was 41.7 points. In 2022, when bonds fell with stocks (see our analysis of the stock bond correlation over time), gold was nearly flat at -0.8%.
Across all 19 full years from 2007 to 2025, gold beat the S&P 500 in 9. Not a better investment, but a different one.
The better question: S&P 500 plus a slice of gold
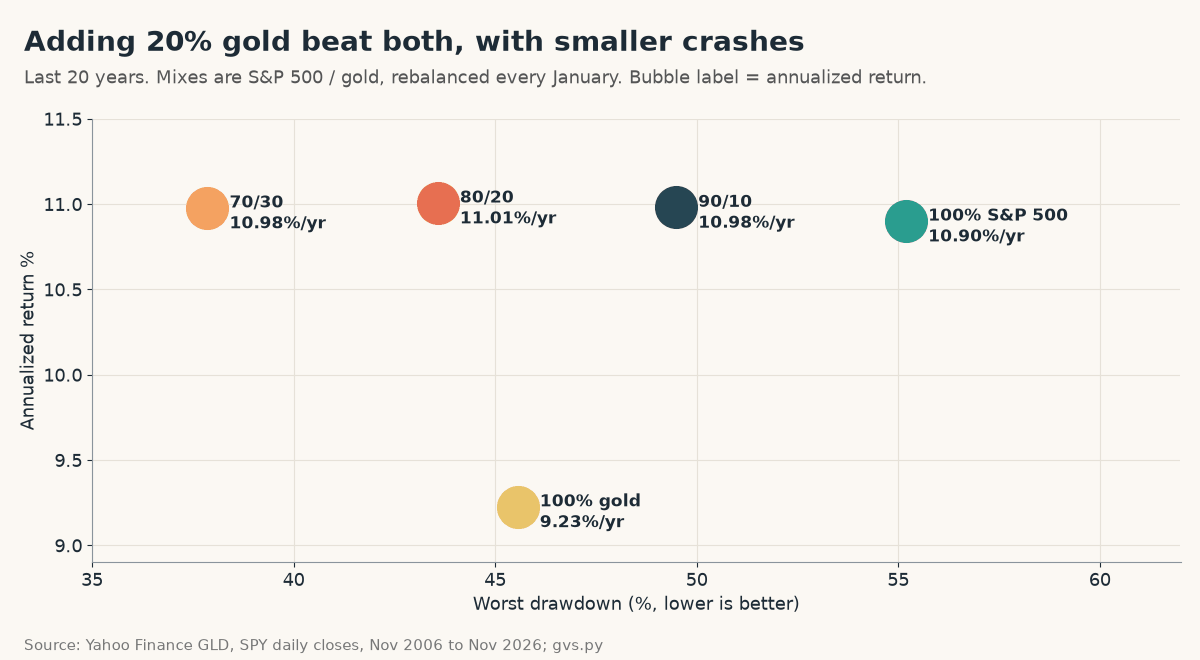
Because gold and stocks are nearly uncorrelated, mixing them changes the result more than picking one. I tested 90/10, 80/20 and 70/30 S&P 500/gold portfolios, rebalanced every January:
| Portfolio (rebalanced each January) | $10,000 grew to | Return per year | Volatility | Worst drawdown |
|---|---|---|---|---|
| 100% S&P 500 | $79,224 | 10.90% | 19.5% | -55.2% |
| 90% S&P / 10% gold | $80,381 | 10.98% | 17.5% | -49.5% |
| 80% S&P / 20% gold | $80,749 | 11.01% | 15.9% | -43.6% |
| 70% S&P / 30% gold | $80,330 | 10.98% | 14.6% | -37.9% |
| 100% gold | $58,437 | 9.23% | 18.2% | -45.6% |
The 80/20 mix finished at $80,749, slightly ahead of 100% stocks ($79,224), with lower volatility (15.9% vs 19.5%) and a smaller worst drawdown (-43.6% vs -55.2%). The 70/30 mix cut the worst drawdown to -37.9% for almost the same return.
That small return edge comes from rebalancing: selling the winner and buying the laggard each January. It is not guaranteed and would shrink after taxes in a taxable account. Our test of how often to rebalance a portfolio shows how much the schedule matters. For a bond-based comparison, see the 60/40 portfolio max drawdown.
The takeaway: gold was a worse long-term holding than the S&P 500 but a useful 10-30% diversifier. With a near-zero correlation (+0.09), a 20% slice cut volatility from 19.5% to 15.9% without lowering the 20-year return.
After inflation
CPI inflation averaged 2.60% a year over the window (FRED CPIAUCSL, through October 2026). That puts real returns at 6.46% a year for gold and 8.09% for the S&P 500 with dividends. Both beat inflation comfortably. The stock market’s real lead is the same 1.6 points.
What this comparison leaves out
- Taxes. I didn’t model them. Gold funds and stock funds can be taxed differently depending on where you live, so check your own situation.
- Spot gold vs GLD. GLD’s price already includes its 0.40% fee, so it trails spot gold slightly. Bullion bars and coins have their own storage and dealer costs.
- Window limits. GLD only exists since November 2004, so the rolling 10-year test has 145 windows, not centuries of data.
- The future. These are historical results. Nothing here predicts which asset wins the next 20 years. Not investment advice.
The Python script
This script downloads GLD and SPY from Yahoo Finance via yfinance (it caches to a src/ folder), then prints every number in this article. You need pip install yfinance pandas and, for the inflation line, the CPI CSV from FRED. New to pandas? Start with the Finxter pandas quickstart.
"""Gold vs S&P 500, last 20 years: GLD vs SPY with dividends, inflation, drawdowns and rolling windows.
pip install yfinance pandas  |  CPI csv: https://fred.stlouisfed.org/graph/fredgraph.csv?id=CPIAUCSL"""
import os
import numpy as np, pandas as pd

def load(ticker):
    path = f"src/{ticker}.pkl"
    if os.path.exists(path):
        return pd.read_pickle(path)
    import yfinance as yf
    d = yf.download(ticker, start="2004-11-01", auto_adjust=False, progress=False)
    d.columns = [c[0] if isinstance(c, tuple) else c for c in d.columns]
    return d

def data():
    g, s = load("GLD"), load("SPY")
    # GLD pays no dividends; SPY "Adj Close" includes reinvested dividends
    return pd.DataFrame({"gold": g["Close"], "spy_tr": s["Adj Close"], "spy_px": s["Close"]}).dropna()

def years(x): return (x.index[-1] - x.index[0]).days / 365.25
def cagr(x): return (x.iloc[-1] / x.iloc[0]) ** (1 / years(x)) - 1
def max_dd(x): return (x / x.cummax() - 1).min()
def vol(x): return x.pct_change().std() * np.sqrt(252)

def last(df, n):
    start = df.index[df.index <= df.index[-1] - pd.DateOffset(years=n)][-1]
    return df.loc[start:]

def longest_underwater(x):
    """Longest time (years) from a peak until the price first gets back to it."""
    peak_date, best, run_start = x.index[0], (0.0, None, None), None
    running_max = x.iloc[0]
    for d, v in x.items():
        if v >= running_max:
            if run_start is not None:
                best = max(best, ((d - peak_date).days / 365.25, peak_date, d))
            running_max, peak_date, run_start = v, d, None
        else:
            run_start = run_start or d
    return best

def blend(w, gold_w):
    """Mix of SPY (total return) and GLD, rebalanced on the first trading day of each year."""
    px = w[["spy_tr", "gold"]].values; tgt = np.array([1 - gold_w, gold_w])
    units, out = tgt / px[0], []
    for i, d in enumerate(w.index):
        if i and d.year != w.index[i - 1].year:
            units = tgt * (units @ px[i]) / px[i]
        out.append(units @ px[i])
    return pd.Series(out, index=w.index)

def gold_win_rate(df, n_years):
    m = df.resample("ME").last(); k = 12 * n_years
    g = (m.gold / m.gold.shift(k)).dropna(); s = (m.spy_tr / m.spy_tr.shift(k)).dropna()
    return (g > s).mean(), len(g)

if __name__ == "__main__":
    df = data(); w = last(df, 20)
    print(f"window {w.index[0]:%Y-%m-%d} .. {w.index[-1]:%Y-%m-%d}")
    for col, name in (("gold", "GLD (gold)"), ("spy_tr", "SPY total return"), ("spy_px", "SPY price only")):
        x = w[col]
        print(f"{name:17s} $10,000 -> ${1e4 * x.iloc[-1] / x.iloc[0]:>7,.0f}  CAGR {cagr(x):6.2%}  "
              f"vol {vol(x):5.1%}  max drawdown {max_dd(x):6.1%}")
    gr = 1e4 * w / w.iloc[0]; pk = df.gold.idxmax()
    print(f"gold peak {pk:%Y-%m-%d}: $10k gold ${gr.gold[pk]:,.0f} vs SPY ${gr.spy_tr[pk]:,.0f}; "
          f"gold now {1 - df.gold.iloc[-1] / df.gold[pk]:.1%} below peak; last day gold led: {gr.index[gr.gold > gr.spy_tr][-1]:%Y-%m-%d}")
    cpi = pd.read_csv("src/CPIAUCSL.csv", parse_dates=[0], index_col=0).iloc[:, 0]
    infl = (cpi.iloc[-1] / cpi[cpi.index <= w.index[0]].iloc[-1]) ** (1 / years(w)) - 1
    print(f"CPI inflation {infl:.2%}/yr -> real CAGR gold {(1+cagr(w.gold))/(1+infl)-1:.2%}, "
          f"SPY {(1+cagr(w.spy_tr))/(1+infl)-1:.2%}")
    for n in (5, 10, 15, 20):
        x = last(df, n); print(f"last {n:2d} yrs: gold {cagr(x.gold):6.2%}  SPY {cagr(x.spy_tr):6.2%}")
    for n in (1, 5, 10):
        p, cnt = gold_win_rate(df, n); print(f"gold beat SPY in {p:.0%} of {cnt} rolling {n}-yr windows")
    for col in ("gold", "spy_tr"):
        u = longest_underwater(df[col]); print(f"{col} longest underwater {u[0]:.1f} yrs ({u[1]:%b %Y} -> {u[2]:%b %Y})")
    for gw in (0.1, 0.2, 0.3):
        b = blend(w, gw)
        print(f"{1-gw:.0%}/{gw:.0%} SPY/GLD: ${1e4*b.iloc[-1]/b.iloc[0]:,.0f}  CAGR {cagr(b):.2%}  vol {vol(b):.1%}  max drawdown {max_dd(b):.1%}")
    yr = df.resample("YE").last().pct_change().loc["2007":"2025"]
    print(f"calendar years 2007-2025: gold won {(yr.gold > yr.spy_tr).sum()} of {len(yr)}")
    for d, r in yr[yr.spy_tr < 0].iterrows():
        print(f"  SPY down year {d.year}: SPY {r.spy_tr:+.1%}, gold {r.gold:+.1%}")
    print(f"  best gold year {yr.gold.idxmax().year}: {yr.gold.max():+.1%}; worst {yr.gold.idxmin().year}: {yr.gold.min():+.1%}")
    m = w.resample("ME").last().pct_change().dropna()
    print(f"monthly return correlation gold vs SPY: {m.gold.corr(m.spy_tr):+.2f}")
Output (run November 12, 2026):
window 2006-11-10 .. 2026-11-11
GLD (gold)        $10,000 -> $ 58,437  CAGR  9.23%  vol 18.2%  max drawdown -45.6%
SPY total return  $10,000 -> $ 79,224  CAGR 10.90%  vol 19.5%  max drawdown -55.2%
SPY price only    $10,000 -> $ 54,963  CAGR  8.89%  vol 19.5%  max drawdown -56.5%
gold peak 2026-01-29: $10k gold $79,357 vs SPY $71,805; gold now 26.4% below peak; last day gold led: 2026-04-07
CPI inflation 2.60%/yr -> real CAGR gold 6.46%, SPY 8.09%
last  5 yrs: gold 15.97%  SPY 11.87%
last 10 yrs: gold 12.05%  SPY 15.19%
last 15 yrs: gold  5.07%  SPY 14.67%
last 20 yrs: gold  9.23%  SPY 10.90%
gold beat SPY in 53% of 253 rolling 1-yr windows
gold beat SPY in 28% of 205 rolling 5-yr windows
gold beat SPY in 13% of 145 rolling 10-yr windows
gold longest underwater 8.9 yrs (Aug 2011 -> Jul 2020)
spy_tr longest underwater 4.9 yrs (Oct 2007 -> Aug 2012)
90%/10% SPY/GLD: $80,381  CAGR 10.98%  vol 17.5%  max drawdown -49.5%
80%/20% SPY/GLD: $80,749  CAGR 11.01%  vol 15.9%  max drawdown -43.6%
70%/30% SPY/GLD: $80,330  CAGR 10.98%  vol 14.6%  max drawdown -37.9%
calendar years 2007-2025: gold won 9 of 19
  SPY down year 2008: SPY -36.8%, gold +4.9%
  SPY down year 2018: SPY -4.6%, gold -1.9%
  SPY down year 2022: SPY -18.2%, gold -0.8%
  best gold year 2025: +63.7%; worst 2013: -28.3%
monthly return correlation gold vs SPY: +0.09
Want to know whether your actual buys beat the S&P 500, with your real dates and amounts? PortfolioTracker24 is a free browser-based tracker with no account and no broker connection. Your trades stay in your browser, it keeps Excel backups, and it compares your portfolio against an S&P 500 equivalent bought on the same dates.
FAQ
Has gold outperformed the S&P 500 over the last 20 years?
No. From November 2006 to November 2026, $10,000 in the S&P 500 (SPY, dividends reinvested) grew to $79,224, or 10.90% a year. The same amount in gold (GLD) grew to $58,437, or 9.23% a year.
Why do some charts show gold beating the S&P 500?
Most charts use price only. Without dividends, the S&P 500 grew $10,000 to just $54,963, below gold. Gold also led as recently as April 7, 2026, after rising 63.7% in 2025.
Has gold beaten the S&P 500 over the last 5 years?
Yes. From November 2021 to November 2026, gold returned 15.97% a year versus 11.87% for the S&P 500 with dividends. Over the last 10 and 15 years, the S&P 500 won.
Is gold a good hedge against stock market crashes?
Often. In 2008 the S&P 500 lost 36.8% while gold gained 4.9%. In 2022 stocks lost 18.2% and gold lost 0.8%. But gold had its own -45.6% drawdown and stayed underwater for 8.9 years after 2011.
How much gold should be in a portfolio?
That depends on your goals, and this is not advice. In this 20-year test, an 80/20 S&P 500/gold mix returned 11.01% a year with a -43.6% worst drawdown, versus 10.90% and -55.2% for 100% stocks.
Bottom line
Over the last 20 years, the S&P 500 with dividends beat gold by $20,787 on a $10,000 start, and all of that lead (plus some) came from reinvested dividends. Gold won short windows, crashed less in 2008 and 2022, and as a 20% slice it made the portfolio smoother without costing return.
If you’re building this into something bigger, like a short investing guide for your readers, ImagineYourBook can turn your notes and tables into a full text draft with a cover. The 7-day trial is $0 with a card and includes one 10,000-word book; if you don’t cancel before day 8, the first charge is $24.99 a month.
Sources (checked November 12, 2026): Yahoo Finance: GLD history · Yahoo Finance: SPY history · yfinance on GitHub · SPDR Gold Shares: GLD inception date, benchmark, 0.40% expense ratio · FRED: CPIAUCSL consumer price index · ImagineYourBook pricing and trial terms · PortfolioTracker24. Script: gvs.py (shown above). Past returns don’t predict future returns. Not investment advice.