
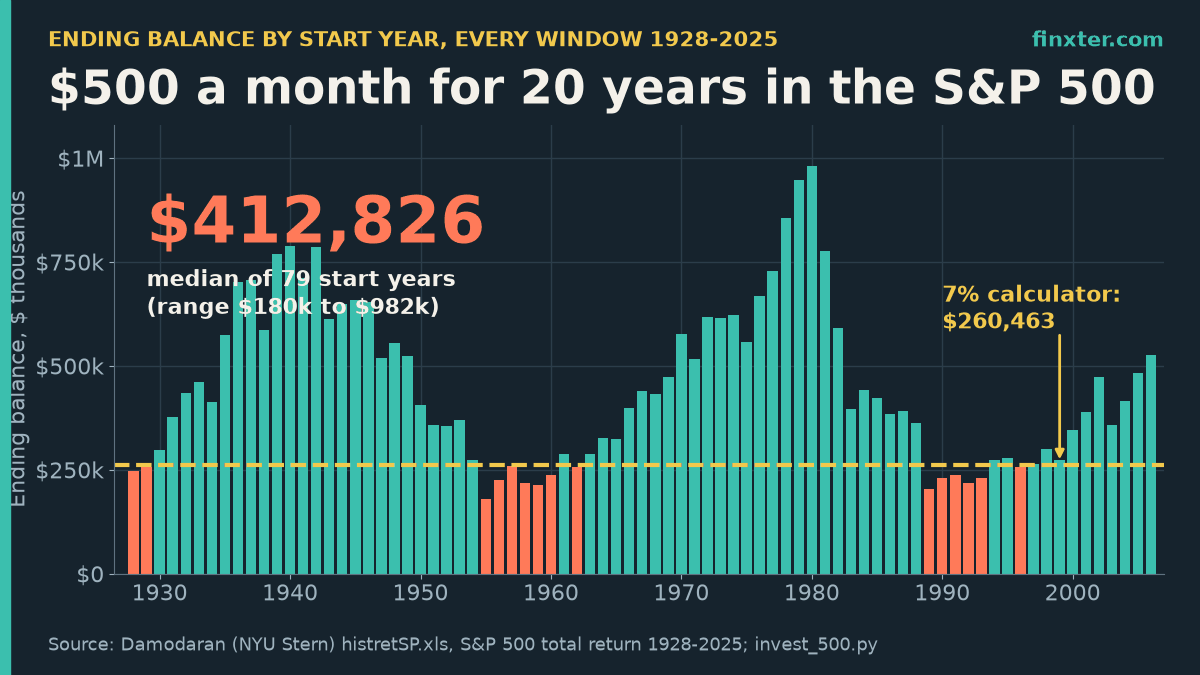
The worst 20 years to invest $500 a month in the S&P 500 didn’t start in 1929. A saver who began in January 1929, months before the crash, ended 1948 with $255,698. A saver who began in 1955 ended 1974 with just $180,173, even though the index itself returned almost three times as much over that stretch (6.99% a year vs 2.37%).
If you invest $500 a month for 20 years, you pay in $120,000. At a steady 7% a year, a calculator says you end with $260,463. History says it depends on which 20 years you get. I ran all 79 rolling 20-year windows of real S&P 500 total returns from 1928 to 2025 (dividends reinvested), with $500 going in every month. The short answer: the median outcome was $412,826, the range was $180,173 to $981,608, and after inflation the median was $264,121, almost exactly the 7% calculator figure.
All numbers come from Aswath Damodaran’s annual S&P 500 dataset (NYU Stern). The Python script and its full output are below, so you can rerun everything.
TL;DR
- If you invest $500 a month for 20 years ($120,000 paid in), the S&P 500 delivered a median $412,826 across 79 historical windows (1928-2025).
- Range: $180,173 (1955-1974) to $981,608 (1980-1999). 64 of 79 windows beat the 7% calculator’s $260,463.
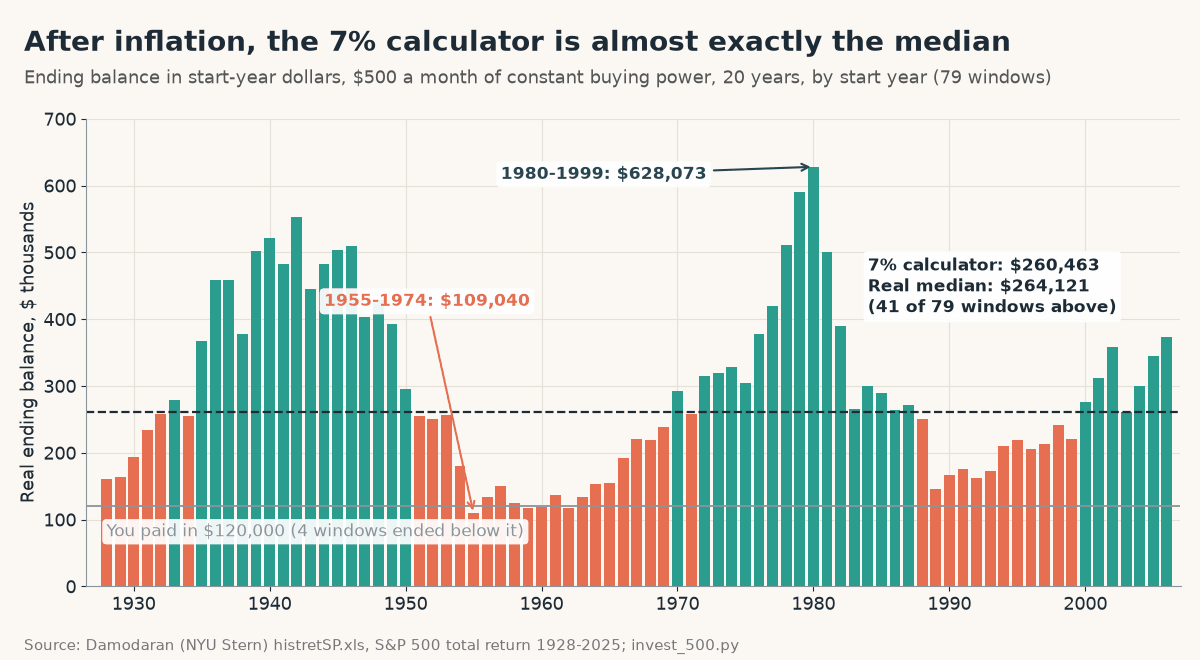
- After inflation the median was $264,121, almost exactly the 7% figure. 4 of 79 windows ended below the money paid in.
- Twist: starting in 1929 beat starting in 1955. The index return isn’t your return; late crashes hurt monthly savers most.
- At 30 years, all 69 windows beat the 7% calculator (median $1,233,125). Python script included.
One side note before the numbers: the market sets your return, but you set the $500. If you want to raise it with a side income, one route is a small catalog of self-published ebooks on Amazon KDP. ImagineYourBook is an AI book-writing tool that turns a prompt or your notes into a complete 10,000-word text draft with a cover, exported as Word and EPUB, with series memory for Book Two. The royalty-to-index-fund math is in the closing section.
What $500 a month for 20 years actually became
For each start year from 1928 to 2006, I deposited $500 at the end of every month for 240 months and applied that year’s S&P 500 total return, spread evenly across its 12 months. That gives 79 overlapping 20-year windows. I ran it twice: once with a flat $500 (what calculators assume), and once in real terms, where the $500 rises with inflation so it always buys the same amount, and the result is shown in start-year dollars.
| Outcome | 20 years, dollars | 20 years, real | 30 years, dollars | 30 years, real |
|---|---|---|---|---|
| Worst | $180,173 | $109,040 | $765,028 | $265,340 |
| 10th percentile | $235,509 | $144,296 | $839,347 | $346,302 |
| 25th percentile | $283,430 | $193,413 | $937,597 | $478,457 |
| Median | $412,826 | $264,121 | $1,233,125 | $606,293 |
| 75th percentile | $589,305 | $378,205 | $1,763,822 | $888,850 |
| 90th percentile | $715,565 | $500,845 | $2,091,803 | $1,107,447 |
| Best | $981,608 | $628,073 | $3,219,338 | $1,306,692 |
| Fixed 7% calculator | $260,463 | $260,463 | $609,985 | $609,985 |
| You paid in | $120,000 | $120,000 | $180,000 | $180,000 |
What the table says:
- In dollars, 64 of 79 windows beat the 7% calculator ($260,463). The 15 that didn’t cluster in three places: the 1928 and 1929 starts (the crash), seven starts from 1955 to 1962 (they ran into the 1970s), and six starts from 1989 to 1996 (2008 landed in their final decade).
- Nobody lost money in dollars. Even the worst window, 1955 to 1974, ended at 1.5x what was paid in.
- Inflation is the real risk. In buying power, 4 of 79 windows ended below the $120,000 paid in: the ones starting in 1955, 1959, 1960 and 1962. All four ended in the 1970s.
- The 7% calculator is a fair real-terms median. After inflation, the median was $264,121, and 41 of 79 windows beat $260,463. So “7%” works as a rough real planning number, not as a nominal one.
The twist: the index return is not your return
The S&P 500’s annual return over a window (its CAGR) assumes one lump sum on day one. A monthly saver owns very little in the early years and a lot in the late years. So what matters most is when the good and bad years land.
I measured each window’s money-weighted return: the single steady rate that turns the same $500 deposits into the same ending balance.
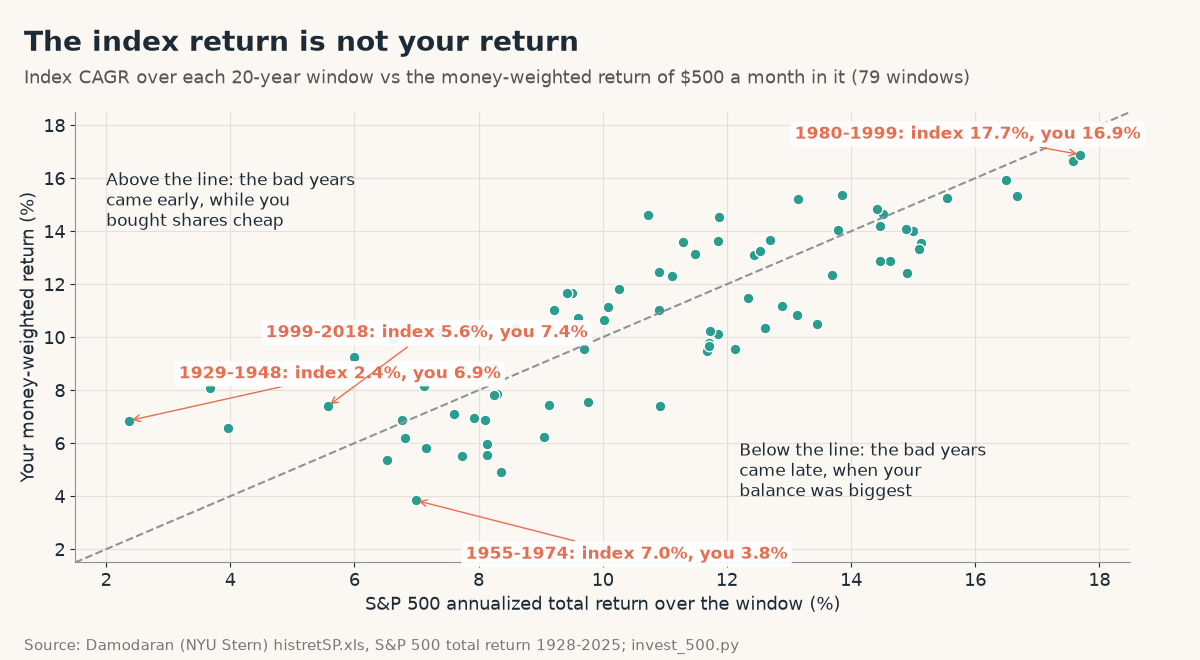
- 1929 to 1948: the index returned just 2.37% a year, but the saver earned 6.85%. The crash hit while the balance was tiny, and every deposit through the early 1930s bought shares near the bottom.
- 1955 to 1974: the index returned 6.99% a year, but the saver earned only 3.84%. Strong 1950s years grew a small balance; the 1973 to 1974 bear market then hit the biggest balance.
- 1999 to 2018: the index returned 5.57% a year, but the saver earned 7.40%, because the dot-com bust and 2008 came while monthly buying was still cheap.
Across all 79 windows, the saver’s return lagged the index by more than 1 point in 31 windows and beat it by more than 1 point in 25. The median money-weighted return was 10.64%, the worst 3.84%, and the best 16.89% (1980 to 1999).
Watch how the paths cross:
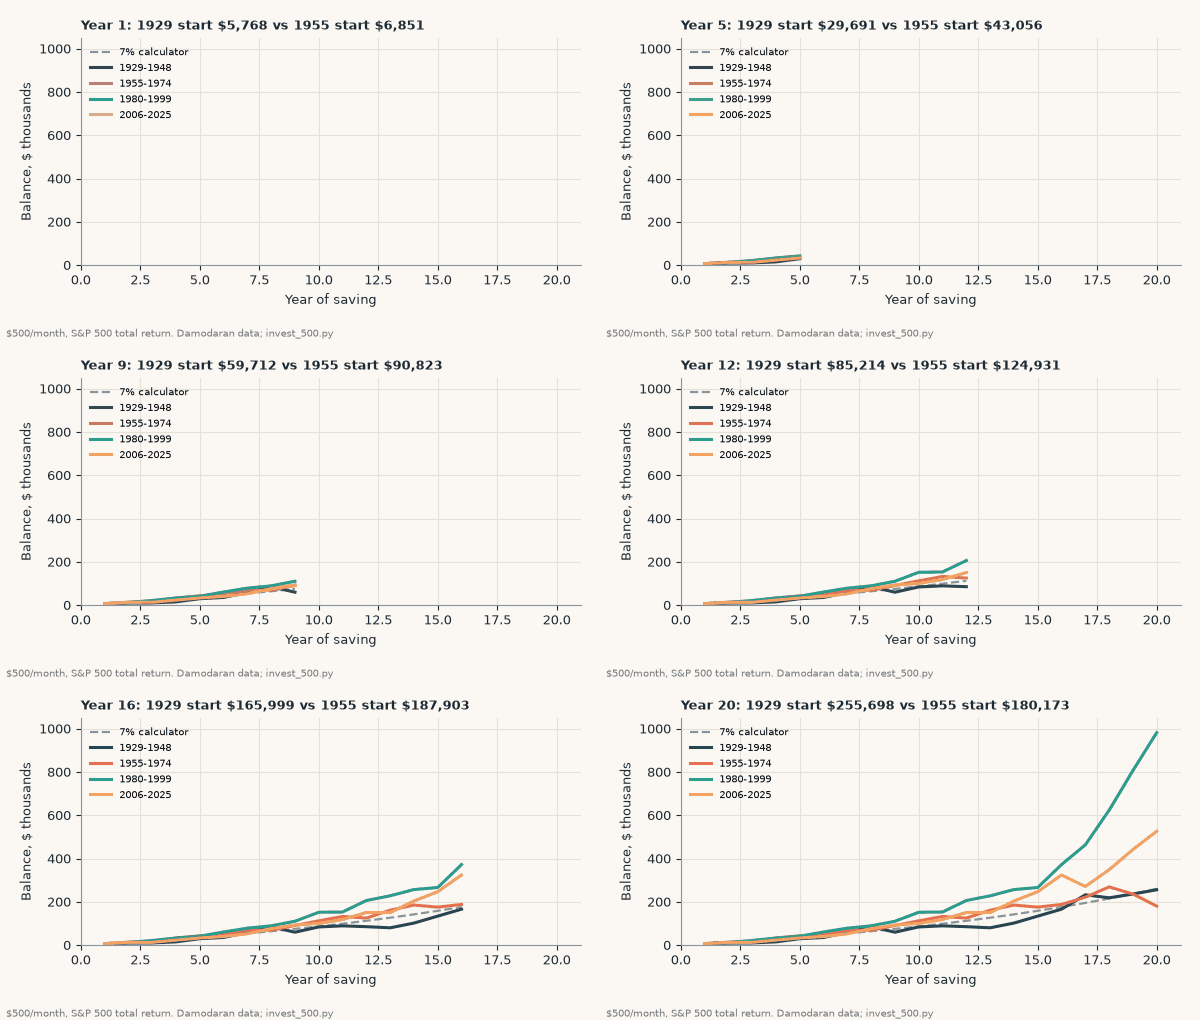
At year 15, the 1955 saver was ahead of the 1929 saver ($175,554 vs $133,993). Over the next five years the 1955 saver deposited another $30,000 and ended only $4,619 higher. The 1929 saver more than doubled, to $255,698.
The rule of thumb: for a monthly saver, a crash in the first 5 years is a sale; a crash in the last 5 years is a bill. The same index return can mean 3.84% or 6.85% a year for you, depending on when it lands.
Why so lopsided? Because of compounding, the median window earned 87% of its total investment gain in the final 10 years. The last decade decides most of the outcome, which is also why order matters so much near retirement (see our sequence of returns risk example).
Worst, typical and best: 9 real start years
| Window | Ending balance | Real (start-year $) | Index return per year | Your return per year | What happened |
|---|---|---|---|---|---|
| 1929 to 1948 | $255,698 | $162,997 | 2.37% | 6.85% | Crash early, cheap shares |
| 1955 to 1974 | $180,173 | $109,040 | 6.99% | 3.84% | Worst: 1973-74 bear market at the end |
| 1962 to 1981 | $256,703 | $116,752 | 6.76% | 6.88% | 1970s inflation |
| 1966 to 1985 | $398,945 | $192,500 | 8.58% | 10.38% | Flat decade early |
| 1975 to 1994 | $558,355 | $304,774 | 14.46% | 12.89% | Strong all the way |
| 1980 to 1999 | $981,608 | $628,073 | 17.69% | 16.89% | Best: 1980s-90s bull market |
| 1990 to 2009 | $230,423 | $167,361 | 8.13% | 5.98% | 2008 at the end |
| 1999 to 2018 | $273,609 | $220,269 | 5.57% | 7.40% | Two crashes early |
| 2006 to 2025 | $526,281 | $372,534 | 10.90% | 12.46% | 2008 early, then a long rally |
The latest complete window, 2006 to 2025, ended at $526,281 ($372,534 in 2006 dollars), a 12.46% money-weighted return, despite starting right before 2008. That’s the “bad years early” pattern again.
What about 30 years?
The 20-year spread is wide. At 30 years ($180,000 paid in, 69 windows), it narrows a lot in relative terms:
- Median $1,233,125, worst $765,028 (1952 to 1981), best $3,219,338 (1970 to 1999).
- All 69 windows beat the 7% calculator ($609,985) in dollars, and 38 of 69 topped $1,130,244, the 10% figure.
- After inflation, the median was $606,293, again almost exactly the 7% calculator. No 30-year window ended below the money paid in, even in real terms (worst: 1.47x).
How to use this if you invest $500 a month
- Plan with 7% as a real return, not a nominal one. Historically, 7% matched the real median for both 20 and 30 years. A plan that needs 10% nominal leans on the better half of history.
- Expect a wide range. At 20 years, the middle half of outcomes ran from $283,430 to $589,305 in dollars. Plan for the 10th percentile ($235,509) if missing the goal would hurt.
- Bad markets early are your friend. Down years in the first decade let your $500 buy more shares. Keep contributing through them; our lump sum vs DCA test shows why the schedule matters.
- Watch the last stretch. With 87% of gains arriving in the last 10 years, a crash near the end costs the most. See the S&P 500 rolling 10-year returns: 11 of 89 decades lost money after inflation.
- Track your own money-weighted return, not the index headline. To see how your actual monthly buys compare with the S&P 500, PortfolioTracker24 is a free, private tracker that runs in your browser: no account, no broker connection, and you can keep an Excel backup. For a Python version of the same check, see compare my portfolio to the S&P 500.
The Python script
It downloads Damodaran’s spreadsheet once (cached to src/), runs every 20- and 30-year window, and prints every number in this article. You need pip install pandas requests xlrd. New to pandas? Start with the Finxter pandas quickstart.
Assumptions: deposits at each month-end; each year’s return is spread evenly over its months (the data is annual); no fees, taxes or cash drag. Real results use Damodaran’s inflation-adjusted returns.
# $500 a month into the S&P 500 for 20 years: every historical window, 1928-2025
# Data: Aswath Damodaran (NYU Stern), histretSP.xls, sheet "Nominal vs Real Data"
import os, sys, requests, pandas as pd

URL = "https://pages.stern.nyu.edu/~adamodar/pc/datasets/histretSP.xls"
FILE = "src/histretSP.xls"
MONTHLY = 500

def load():
    if not os.path.exists(FILE):
        os.makedirs("src", exist_ok=True)
        open(FILE, "wb").write(requests.get(URL, headers={"User-Agent": "Mozilla/5.0"}).content)
    df = pd.read_excel(FILE, "Nominal vs Real Data", usecols=[0, 1, 4, 5])
    df.columns = ["year", "nominal", "inflation", "real"]
    df = df[pd.to_numeric(df.year, errors="coerce").notna()].astype(float)
    return df.astype({"year": int}).set_index("year")

def grow(returns, monthly=MONTHLY):
    """Deposit at each month-end; each year's return is spread evenly over its 12 months."""
    bal = 0.0
    for r in returns:
        m = (1 + r) ** (1 / 12) - 1
        for _ in range(12):
            bal = bal * (1 + m) + monthly
    return bal

def fixed(rate, years, monthly=MONTHLY):
    """What a typical online calculator shows: a constant annual rate, compounded monthly."""
    i = rate / 12
    return monthly * ((1 + i) ** (12 * years) - 1) / i

def irr(balance, years):
    """Constant annual rate (monthly compounding) that turns the same deposits into the same balance."""
    lo, hi = -0.3, 0.5
    for _ in range(100):
        mid = (lo + hi) / 2
        lo, hi = (mid, hi) if fixed(mid, years) < balance else (lo, mid)
    return mid

def windows(df, years):
    rows = []
    for start in range(df.index[0], df.index[-1] - years + 2):
        w = df.loc[start:start + years - 1]
        nom = grow(w.nominal)
        before_last10 = grow(w.nominal.iloc[:-10]) * (1 + w.nominal.iloc[-10:]).prod()  # old money only
        rows.append(dict(start=start, end=start + years - 1, nominal=nom, real=grow(w.real),
                         cagr=(1 + w.nominal).prod() ** (1 / years) - 1, irr=irr(nom, years),
                         at_year10=grow(w.nominal.iloc[:10]),
                         last10_gain=(nom - grow(w.nominal.iloc[:-10]) - MONTHLY * 120) / (nom - MONTHLY * 12 * years)))
    return pd.DataFrame(rows).set_index("start")

def report(df, years):
    res, paid = windows(df, years), MONTHLY * 12 * years
    print(f"\n=== {years} YEARS: {len(res)} rolling windows, you pay in ${paid:,.0f} ===")
    for col, label in (("nominal", "NOMINAL ($500 flat)"), ("real", "REAL ($500 of start-year buying power, in start-year dollars)")):
        s = res[col]
        print(f"{label}\n  median ${s.median():,.0f} | worst ${s.min():,.0f} ({s.idxmin()}-{s.idxmin()+years-1}) | "
              f"best ${s.max():,.0f} ({s.idxmax()}-{s.idxmax()+years-1})\n"
              f"  10th pct ${s.quantile(.1):,.0f} | 25th ${s.quantile(.25):,.0f} | 75th ${s.quantile(.75):,.0f} | 90th ${s.quantile(.9):,.0f}")
    for rate in (0.07, 0.10):
        f = fixed(rate, years)
        print(f"Calculator at {rate:.0%}: ${f:,.0f}; nominal windows beating it: {(res.nominal > f).sum()} of {len(res)}; "
              f"real windows beating it: {(res.real > f).sum()}")
    print(f"Real below ${paid:,.0f} paid in: {(res.real < paid).sum()} of {len(res)}; worst real multiple {res.real.min()/paid:.2f}x")
    print(f"Money-weighted return: median {res.irr.median():.2%}, worst {res.irr.min():.2%}, best {res.irr.max():.2%}")
    print(f"Your return lagged the index CAGR by >1 pt in {((res.cagr - res.irr) > 0.01).sum()} windows, beat it by >1 pt in {((res.irr - res.cagr) > 0.01).sum()}")
    print(f"Share of all investment gain earned in the final 10 years: median {res.last10_gain.median():.0%}")
    return res

if __name__ == "__main__":
    df = load()
    print(f"data {df.index[0]}-{df.index[-1]}")
    res = report(df, 20)
    lead10 = res.at_year10.idxmax()
    print(f"Top balance after 10 years: {lead10}-{lead10+19} (${res.at_year10[lead10]:,.0f}), finished at ${res.nominal[lead10]:,.0f}, "
          f"rank {int((res.nominal > res.nominal[lead10]).sum()) + 1} of {len(res)}; corr(year-10 balance, final) {res[['at_year10','nominal']].corr().iloc[0,1]:.2f}")
    for s in (1929, 1955, 1962, 1966, 1975, 1980, 1990, 1999, 2006):
        r = res.loc[s]
        print(f"  {s}-{int(r.end)}: nominal ${r.nominal:,.0f}, real ${r.real:,.0f}, index CAGR {r.cagr:.2%}, your return {r.irr:.2%}")
    res.round(4).to_csv("windows20.csv")
    report(df, 30).round(4).to_csv("windows30.csv")
Output (data through 2025):
data 1928-2025

=== 20 YEARS: 79 rolling windows, you pay in $120,000 ===
NOMINAL ($500 flat)
  median $412,826 | worst $180,173 (1955-1974) | best $981,608 (1980-1999)
  10th pct $235,509 | 25th $283,430 | 75th $589,305 | 90th $715,565
REAL ($500 of start-year buying power, in start-year dollars)
  median $264,121 | worst $109,040 (1955-1974) | best $628,073 (1980-1999)
  10th pct $144,296 | 25th $193,413 | 75th $378,205 | 90th $500,845
Calculator at 7%: $260,463; nominal windows beating it: 64 of 79; real windows beating it: 41
Calculator at 10%: $379,684; nominal windows beating it: 46 of 79; real windows beating it: 19
Real below $120,000 paid in: 4 of 79; worst real multiple 0.91x
Money-weighted return: median 10.64%, worst 3.84%, best 16.89%
Your return lagged the index CAGR by >1 pt in 31 windows, beat it by >1 pt in 25
Share of all investment gain earned in the final 10 years: median 87%
Top balance after 10 years: 1946-1965 ($188,038), finished at $654,262, rank 14 of 79; corr(year-10 balance, final) 0.35
  1929-1948: nominal $255,698, real $162,997, index CAGR 2.37%, your return 6.85%
  1955-1974: nominal $180,173, real $109,040, index CAGR 6.99%, your return 3.84%
  1962-1981: nominal $256,703, real $116,752, index CAGR 6.76%, your return 6.88%
  1966-1985: nominal $398,945, real $192,500, index CAGR 8.58%, your return 10.38%
  1975-1994: nominal $558,355, real $304,774, index CAGR 14.46%, your return 12.89%
  1980-1999: nominal $981,608, real $628,073, index CAGR 17.69%, your return 16.89%
  1990-2009: nominal $230,423, real $167,361, index CAGR 8.13%, your return 5.98%
  1999-2018: nominal $273,609, real $220,269, index CAGR 5.57%, your return 7.40%
  2006-2025: nominal $526,281, real $372,534, index CAGR 10.90%, your return 12.46%

=== 30 YEARS: 69 rolling windows, you pay in $180,000 ===
NOMINAL ($500 flat)
  median $1,233,125 | worst $765,028 (1952-1981) | best $3,219,338 (1970-1999)
  10th pct $839,347 | 25th $937,597 | 75th $1,763,822 | 90th $2,091,803
REAL ($500 of start-year buying power, in start-year dollars)
  median $606,293 | worst $265,340 (1952-1981) | best $1,306,692 (1970-1999)
  10th pct $346,302 | 25th $478,457 | 75th $888,850 | 90th $1,107,447
Calculator at 7%: $609,985; nominal windows beating it: 69 of 69; real windows beating it: 34
Calculator at 10%: $1,130,244; nominal windows beating it: 38 of 69; real windows beating it: 7
Real below $180,000 paid in: 0 of 69; worst real multiple 1.47x
Money-weighted return: median 10.41%, worst 8.13%, best 14.69%
Your return lagged the index CAGR by >1 pt in 27 windows, beat it by >1 pt in 10
Share of all investment gain earned in the final 10 years: median 75%
FAQ
How much will I have if I invest $500 a month for 20 years?
In the S&P 500 from 1928 to 2025, the median of 79 rolling 20-year windows was $412,826 on $120,000 paid in. The range was $180,173 to $981,608. A fixed 7% calculator says $260,463.
Is 7% a realistic return for $500 a month?
As a real, after-inflation number, yes historically: the real median of $264,121 almost matches the 7% figure of $260,463. As a nominal number it was conservative; 64 of 79 windows beat it.
Can you lose money investing $500 a month for 20 years?
Not in dollars in any S&P 500 window since 1928; the worst ended at 1.5x the money paid in. After inflation, 4 of 79 windows ended below it, all finishing in the 1970s.
What was the worst 20 years to invest monthly?
1955 to 1974: $180,173, a 3.84% money-weighted return, even though the index returned 6.99% a year. The 1973 to 1974 bear market hit when the balance was largest.
What does $500 a month become in 30 years?
Across 69 rolling 30-year windows, the median was $1,233,125 on $180,000 paid in, the worst $765,028 (1952 to 1981). Every window beat the 7% calculator's $609,985.
The takeaway: the market sets the return, you set the $500
If you invest $500 a month for 20 years, history gave a median of $412,826 and a real-terms median right at the 7% calculator’s $260,463. You can’t choose your 20 years. You can choose how much goes in, and the math scales in a straight line: every extra $100 a month adds one fifth of these numbers.
Here’s the napkin math for that lever. Amazon KDP’s 70% royalty option pays 70% of the list price minus delivery costs, which Amazon says average $0.06 per unit. At $4.99, that’s about $3.43 per sale. Assumption, not a typical result: if a few books together sold 30 copies a month, that’s about $103 a month. Invest $100 of it every month for 20 years, and the historical median adds about $82,565 to your balance ($52,824 in real terms). Sales are never guaranteed and many books sell far less, so treat this as a scenario to test, not a promise. Run your own numbers with the KDP royalty calculator.
If you want to try that route, ImagineYourBook turns an idea or your notes into a full text draft with a cover, ready to edit and publish on KDP. The 7-day trial is $0 with a card and includes one 10,000-word book; if you don’t cancel before day 8, the first charge is $24.99 a month. You still do the editing, the fact check and the marketing.
Sources (checked November 17, 2026): Aswath Damodaran (NYU Stern): Historical returns on stocks, bonds and bills, 1928-2025 · histretSP.xls (S&P 500 total return, inflation, real return) · Amazon KDP: eBook Royalties · ImagineYourBook pricing and trial terms · PortfolioTracker24. Script: invest_500.py (shown above). Past returns don’t predict future returns. Not investment advice.