How to Fit a Curve to Power-law Distributed Data in Python
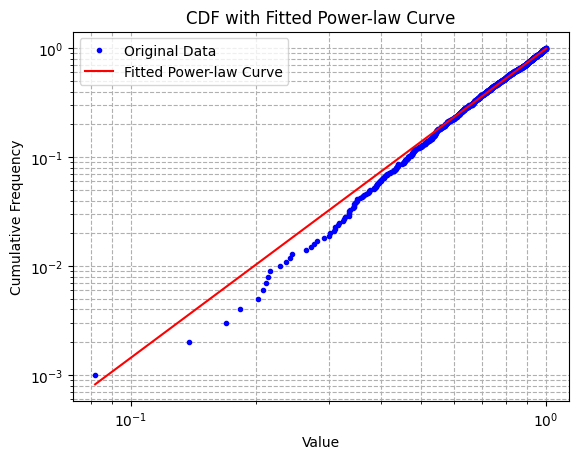
In this tutorial, you’ll learn how to generate synthetic data that follows a power-law distribution, plot its cumulative distribution function (CDF), and fit a power-law curve to this CDF using Python. This process is useful for analyzing datasets that follow power-law distributions, which are common in natural and social phenomena. Prerequisites Ensure you have Python … Read more