4% Rule Calculator: I Backtested All 69 US Retirements Since 1928, and 65 Survived
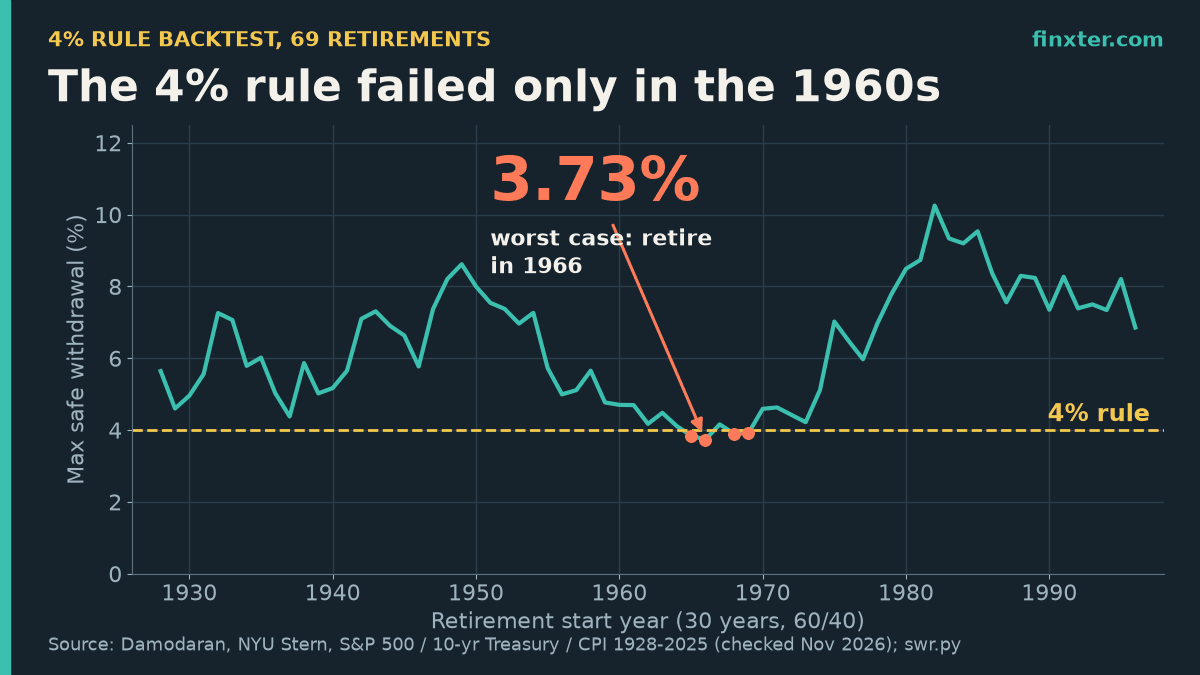
4% rule calculator with a real backtest: 4% withdrawals survived 65 of 69 US 30-year retirements since 1928. Run your numbers, see the grid, get the Python.

4% rule calculator with a real backtest: 4% withdrawals survived 65 of 69 US 30-year retirements since 1928. Run your numbers, see the grid, get the Python.
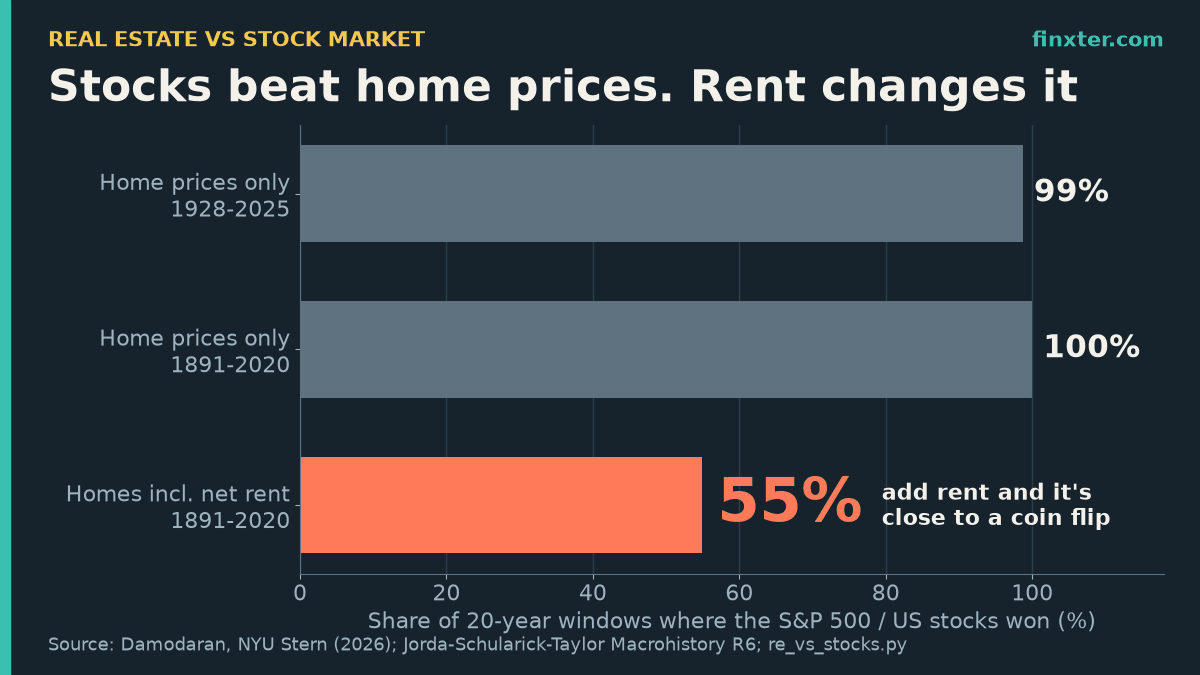
Real estate vs stock market: stocks beat home prices in 78 of 79 20-year windows, but only 61 of 111 (55%) once you count rent. Data and Python inside.
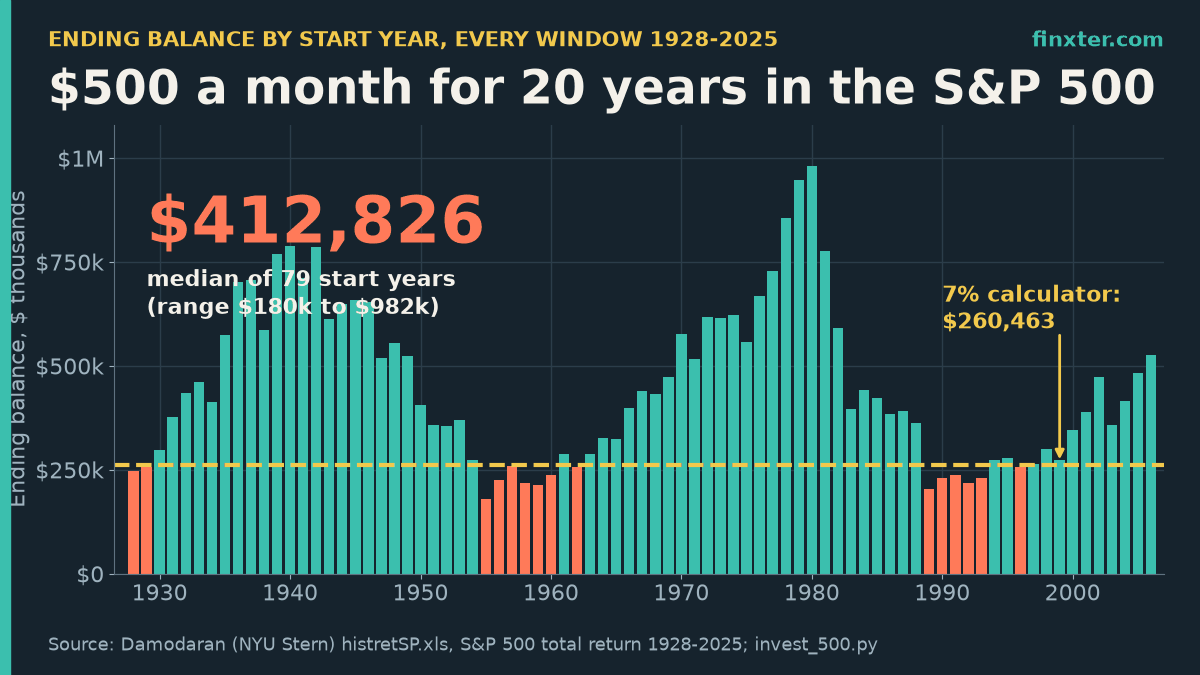
Invest $500 a month for 20 years in the S&P 500: 79 real windows (1928-2025) ended at $180,173 to $981,608, median $412,826. Python script inside.
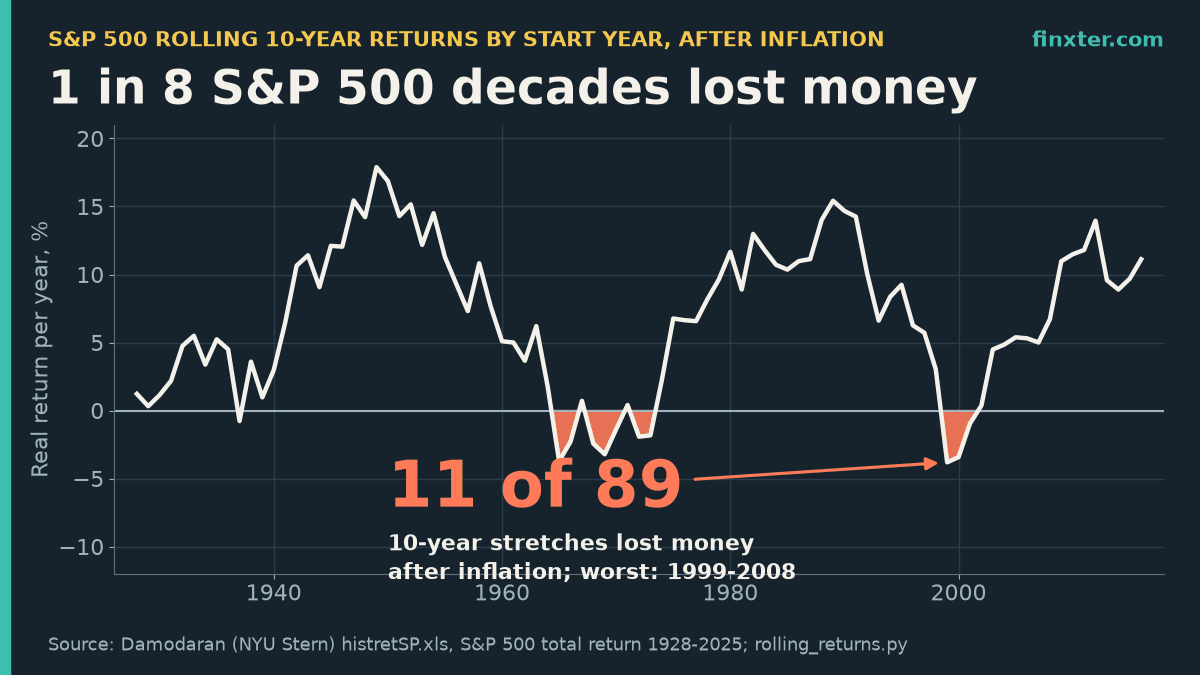
S&P 500 rolling 10-year returns 1928-2025: median 6.71% after inflation, 11 of 89 decades lost money, worst 1999-2008. Python script inside.
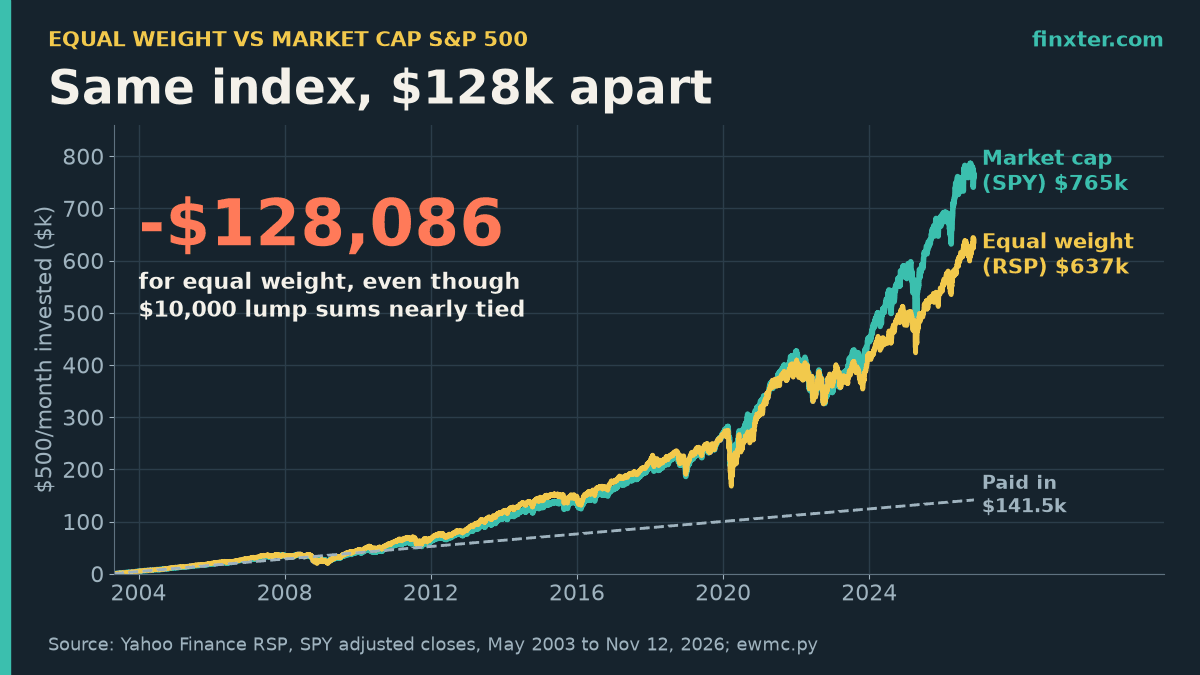
Equal weight vs market cap S&P 500 performance: a $10,000 tie since 2003 ($124,203 vs $126,266) but a $128,086 gap at $500/month. Python inside.
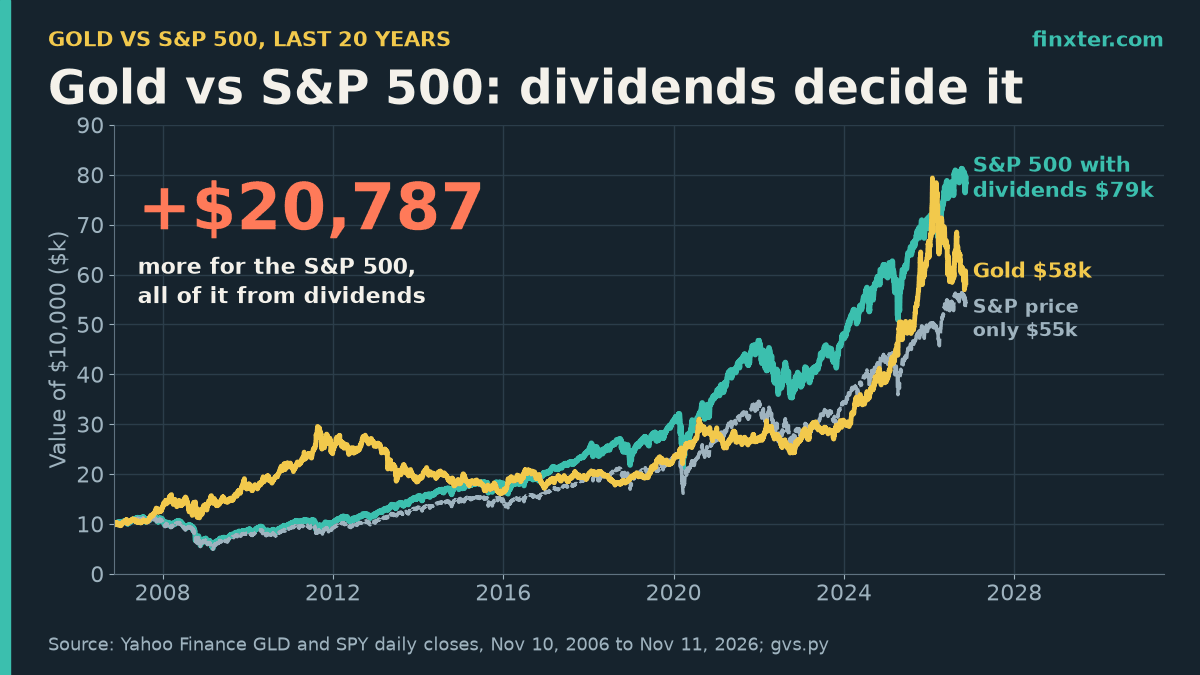
Gold vs S&P 500 last 20 years: $10,000 became $79,224 in SPY with dividends vs $58,437 in gold. Win rates, drawdowns, 80/20 mix + Python.
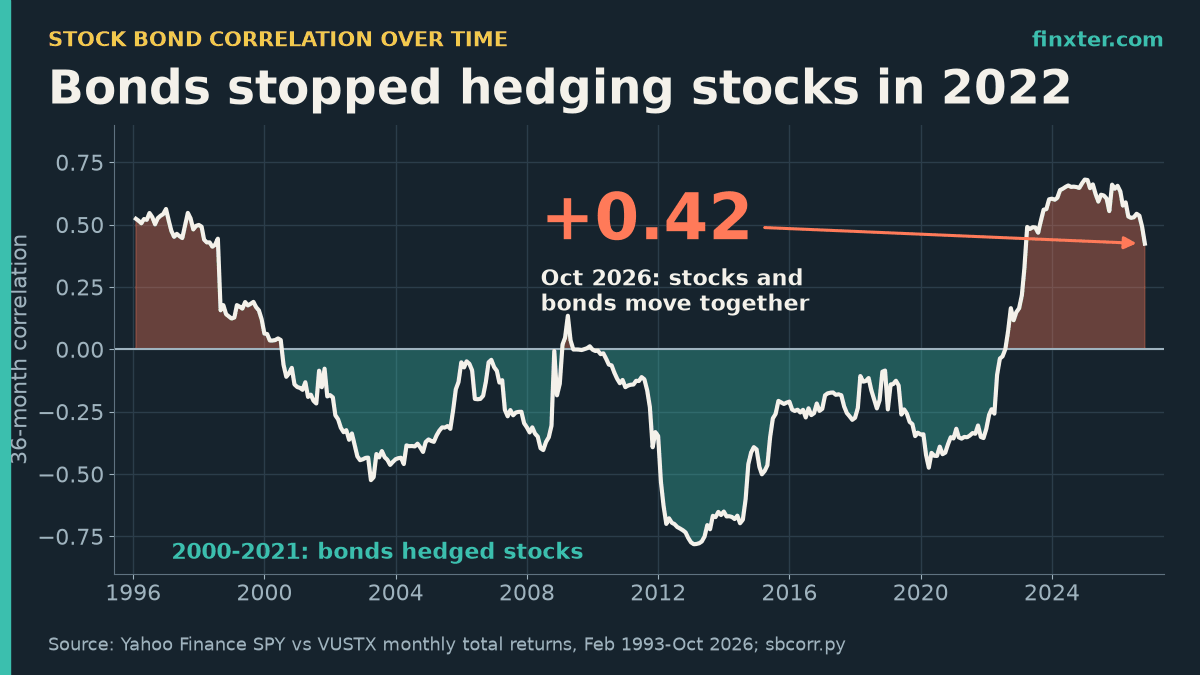
Stock bond correlation over time, 1993-2026: SPY vs Treasuries was -0.29 in 2000-2021, +0.42 now. Inflation link, 60/40 impact + Python.
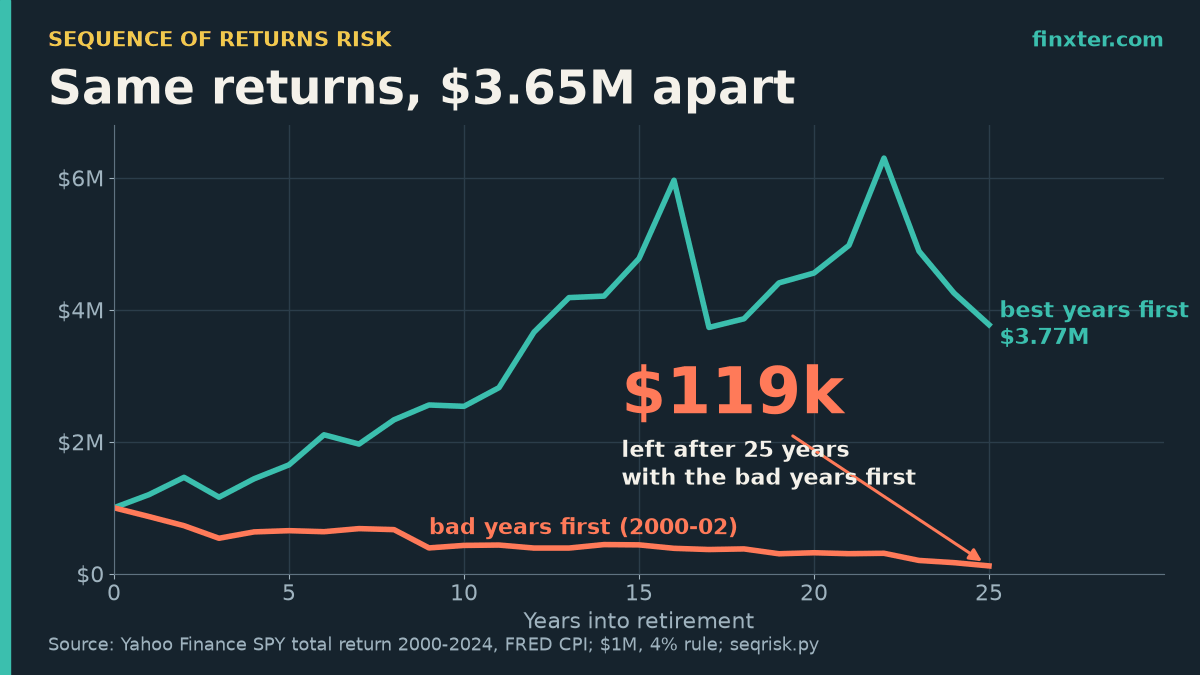
Sequence of returns risk example: same 25 SPY years, $1M, 4% rule. Real order ends at $119,235, reversed at $3.77M. Charts, fix + Python.
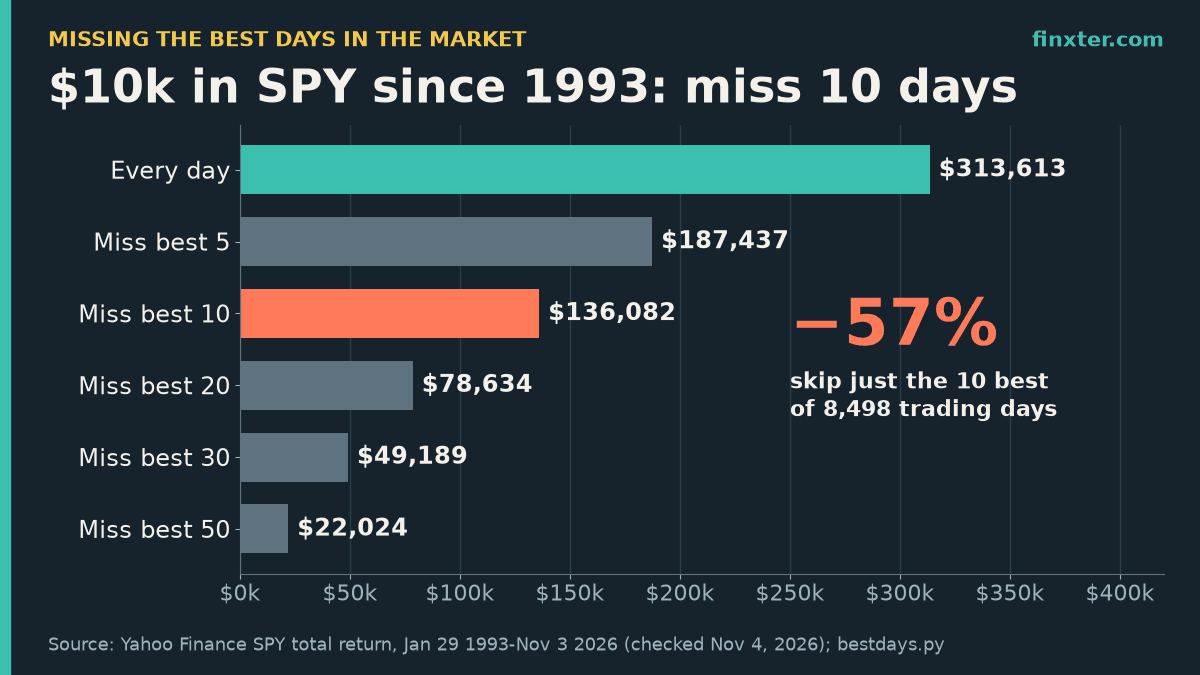
Missing the best days in the market, tested: skip SPY’s 10 best days since 1993 and $10k ends at $136,082, not $313,613 (−57%). Charts + Python.
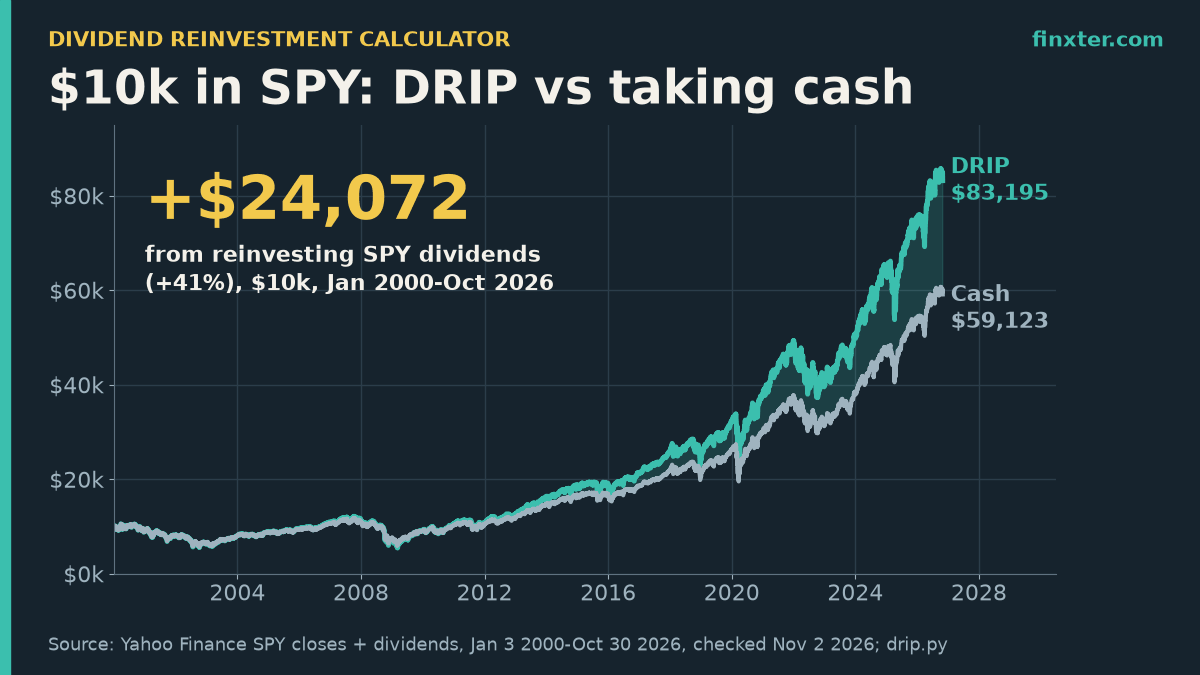
Dividend reinvestment calculator on real data: $10k in SPY became $83,195 with DRIP vs $59,123 as cash since 2000. VYM, SCHD, QQQ, taxes, Python.
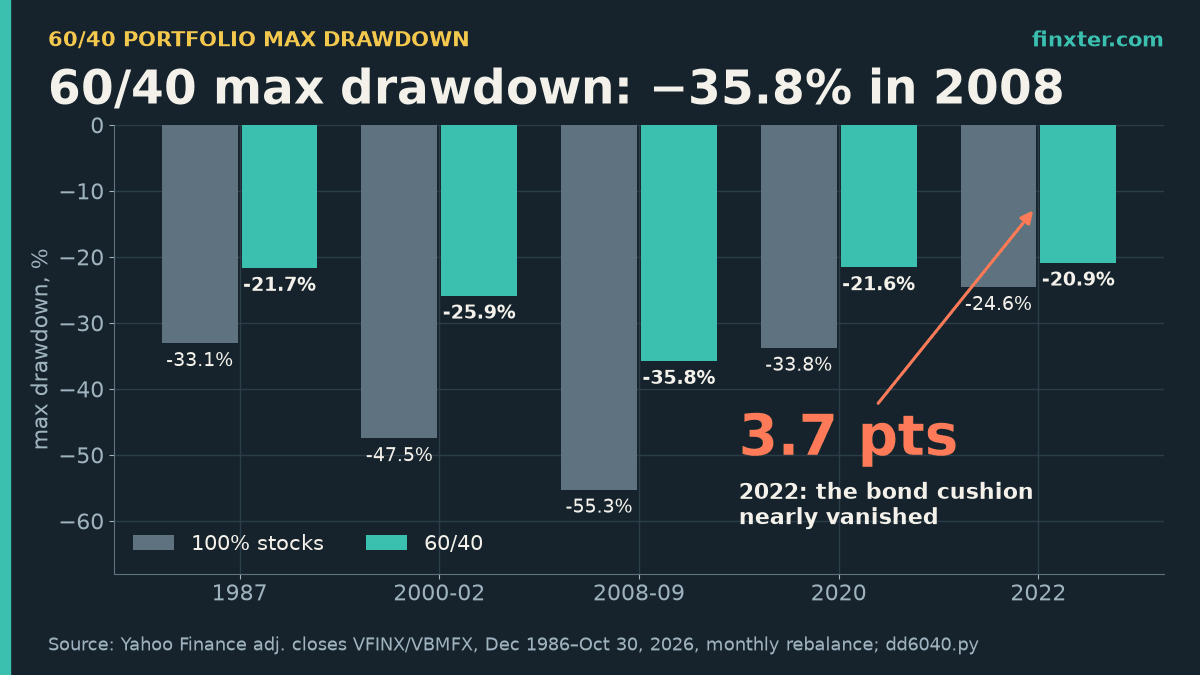
60/40 portfolio max drawdown: −35.8% in 2008 vs −55.3% for stocks, but only a 3.7-point cushion in 2022. Daily data since 1986, tables, Python.
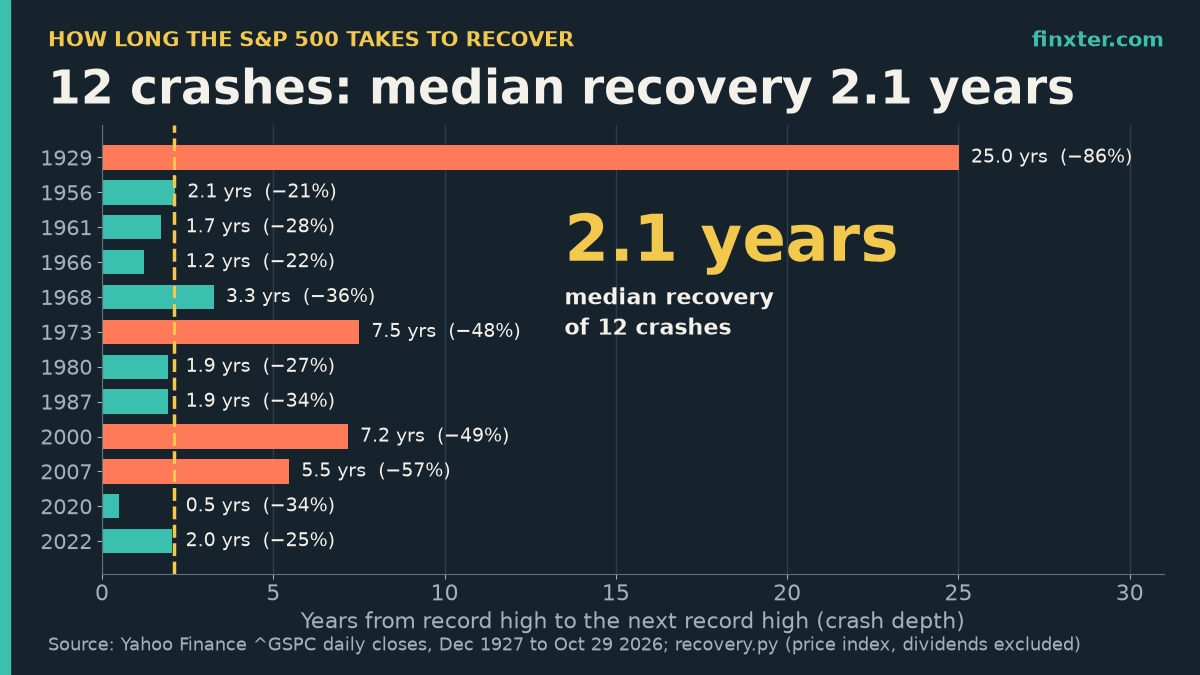
How long does it take the stock market to recover from a crash? S&P 500 median: 2.1 years across 12 crashes since 1928. Depth table, dividends, Python.