Stock Bond Correlation Over Time: 33 Years of SPY vs Treasuries, and Why It’s +0.42 Now (Python)
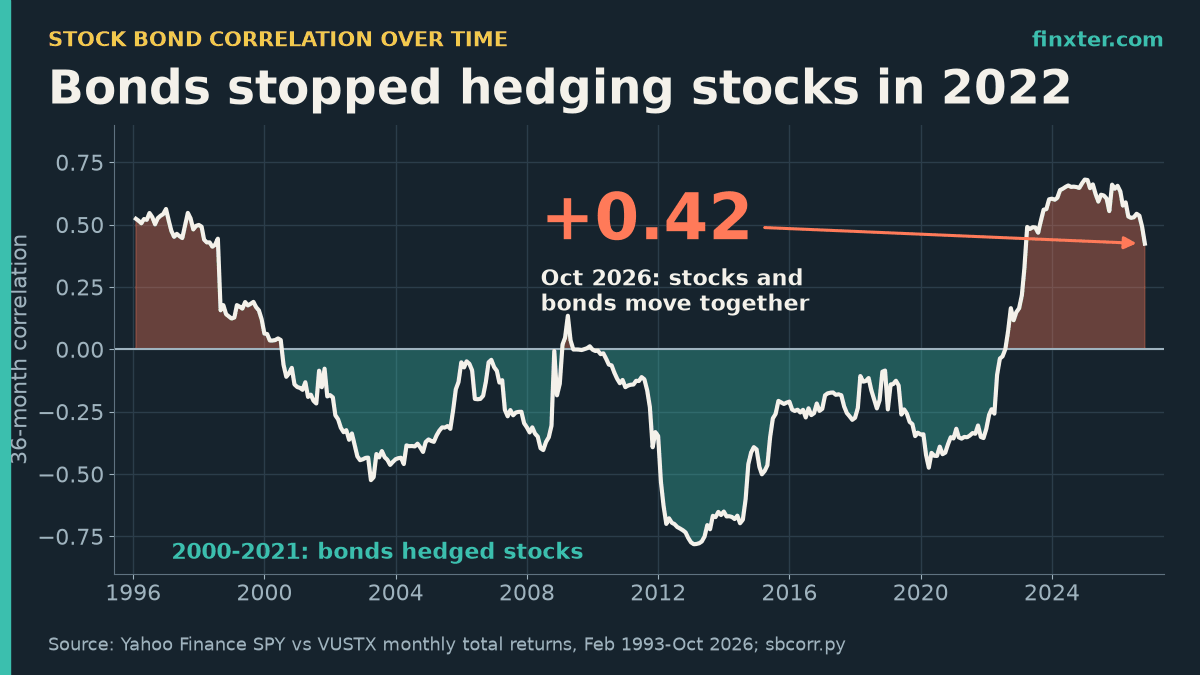
Stock bond correlation over time, 1993-2026: SPY vs Treasuries was -0.29 in 2000-2021, +0.42 now. Inflation link, 60/40 impact + Python.

Stock bond correlation over time, 1993-2026: SPY vs Treasuries was -0.29 in 2000-2021, +0.42 now. Inflation link, 60/40 impact + Python.
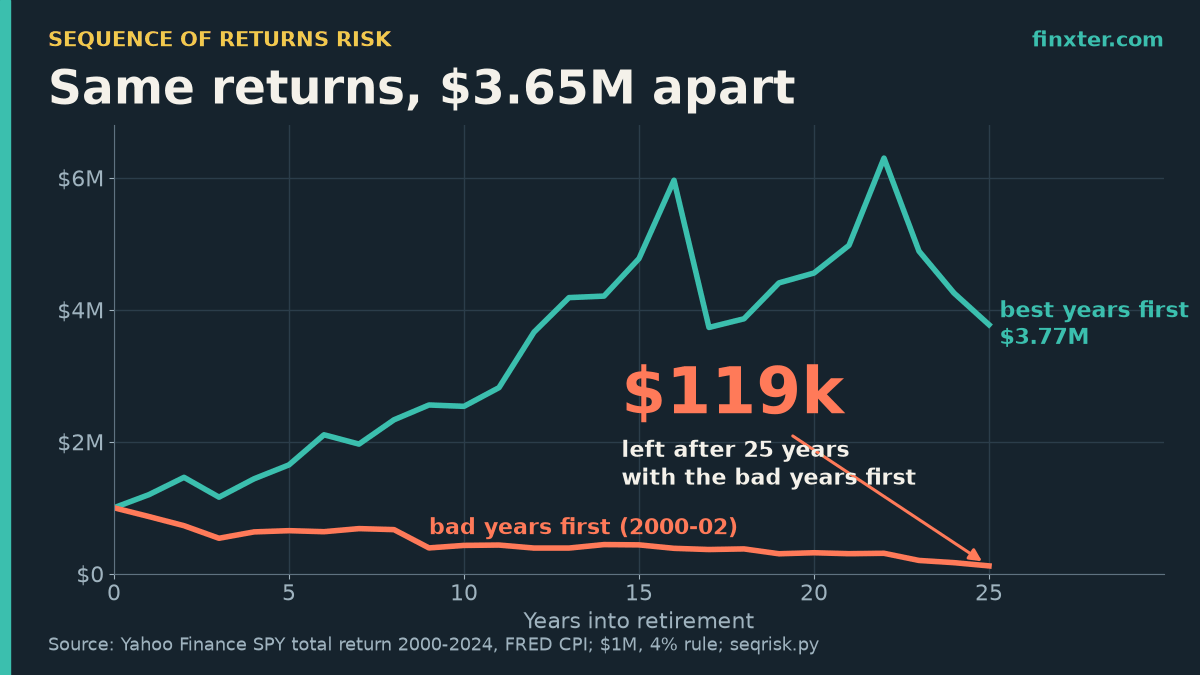
Sequence of returns risk example: same 25 SPY years, $1M, 4% rule. Real order ends at $119,235, reversed at $3.77M. Charts, fix + Python.
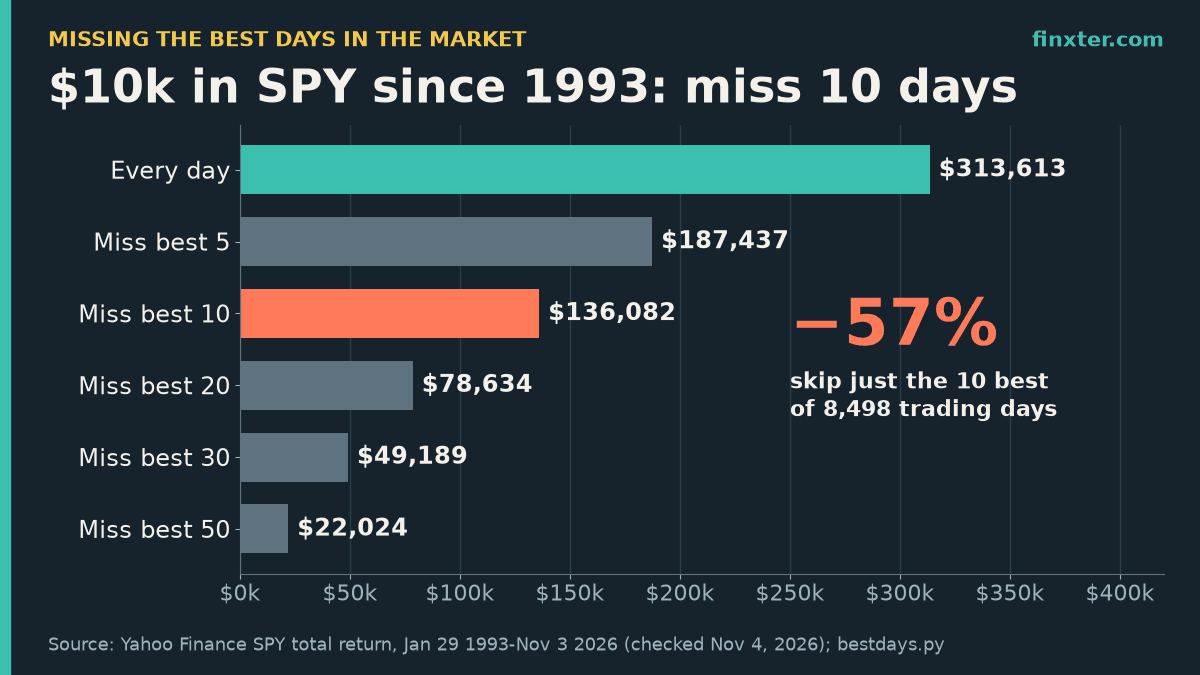
Missing the best days in the market, tested: skip SPY’s 10 best days since 1993 and $10k ends at $136,082, not $313,613 (−57%). Charts + Python.
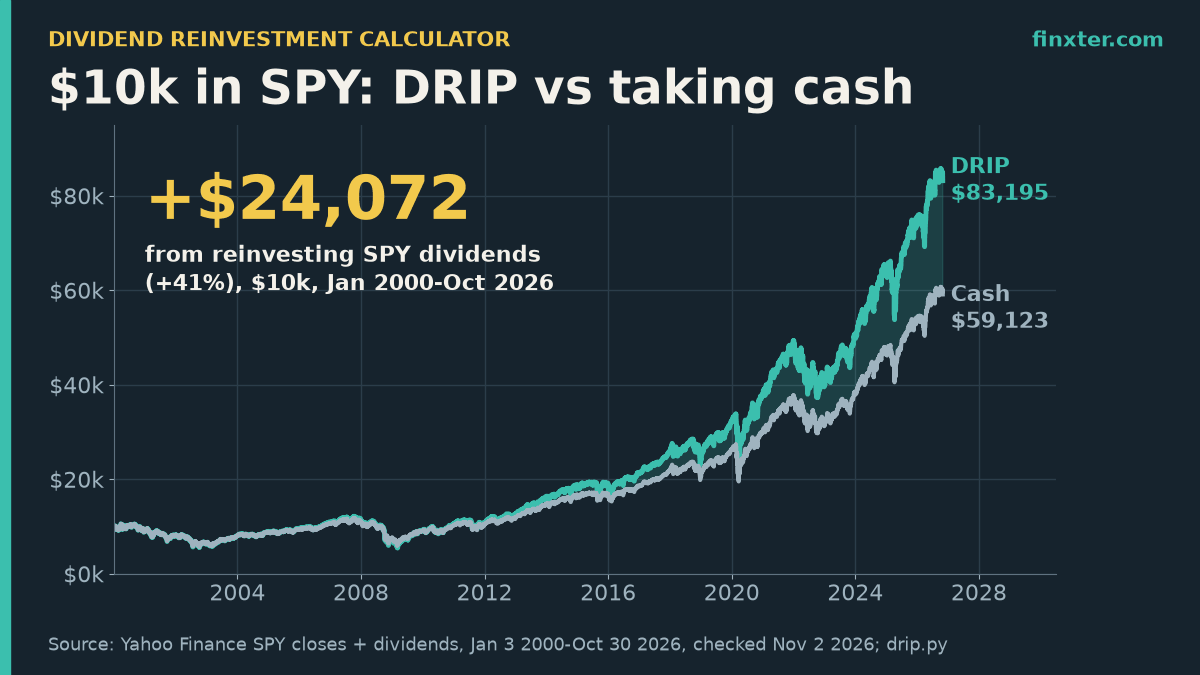
Dividend reinvestment calculator on real data: $10k in SPY became $83,195 with DRIP vs $59,123 as cash since 2000. VYM, SCHD, QQQ, taxes, Python.
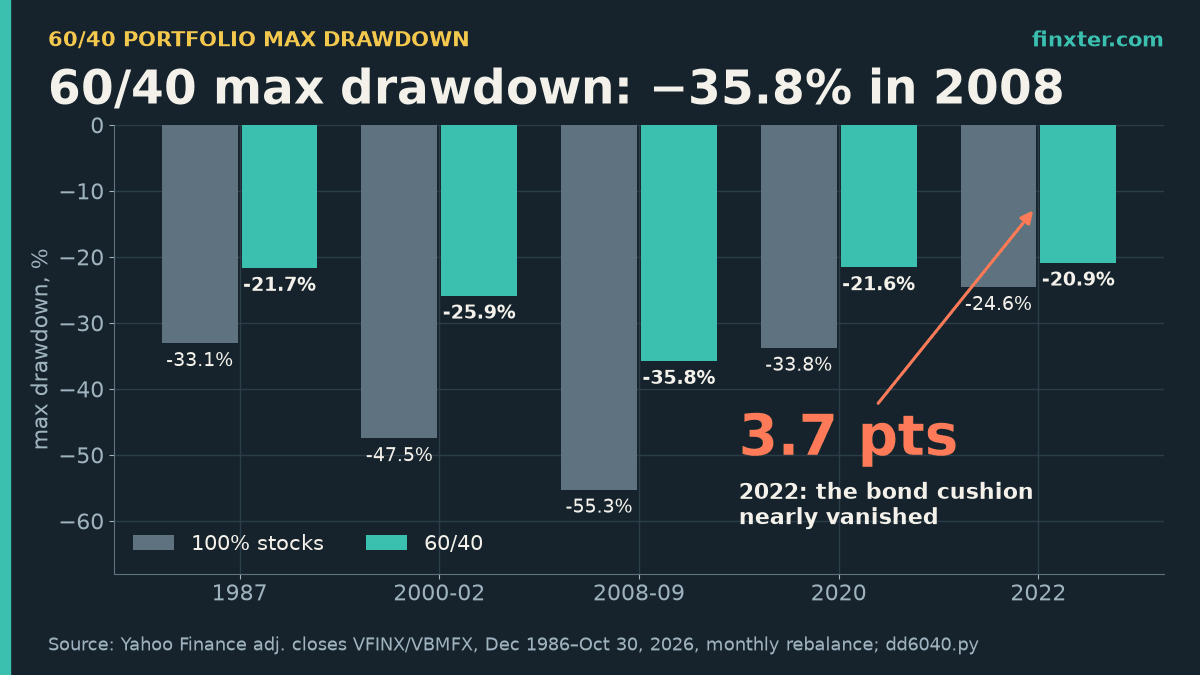
60/40 portfolio max drawdown: −35.8% in 2008 vs −55.3% for stocks, but only a 3.7-point cushion in 2022. Daily data since 1986, tables, Python.
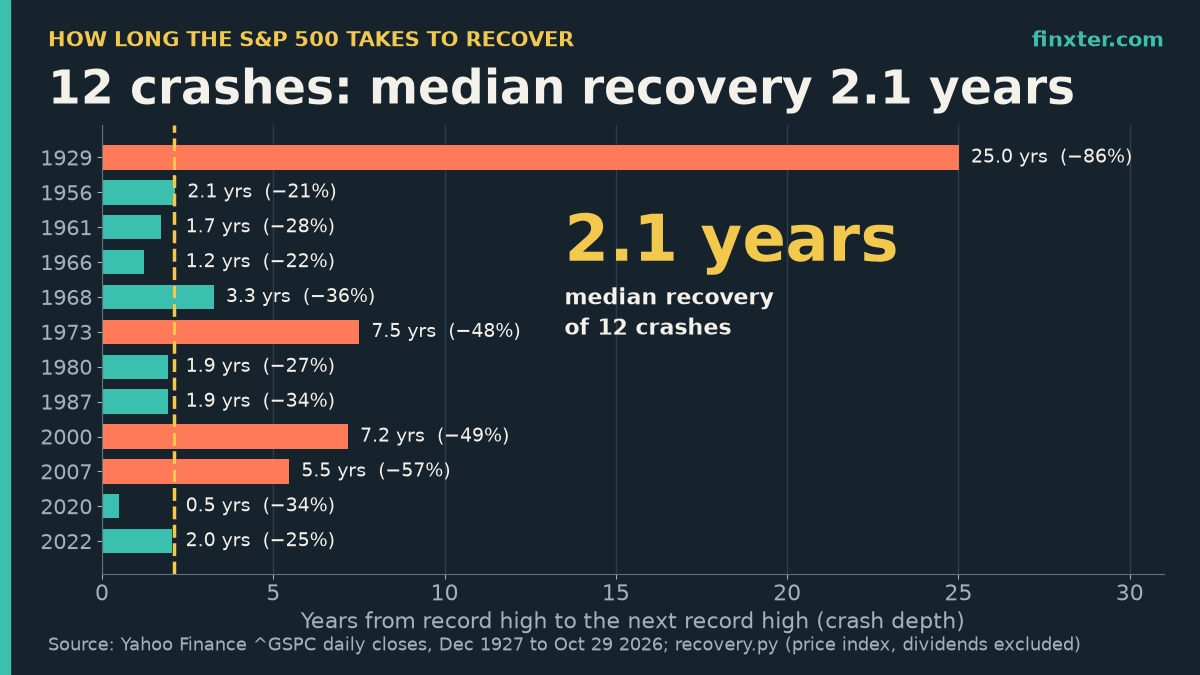
How long does it take the stock market to recover from a crash? S&P 500 median: 2.1 years across 12 crashes since 1928. Depth table, dividends, Python.
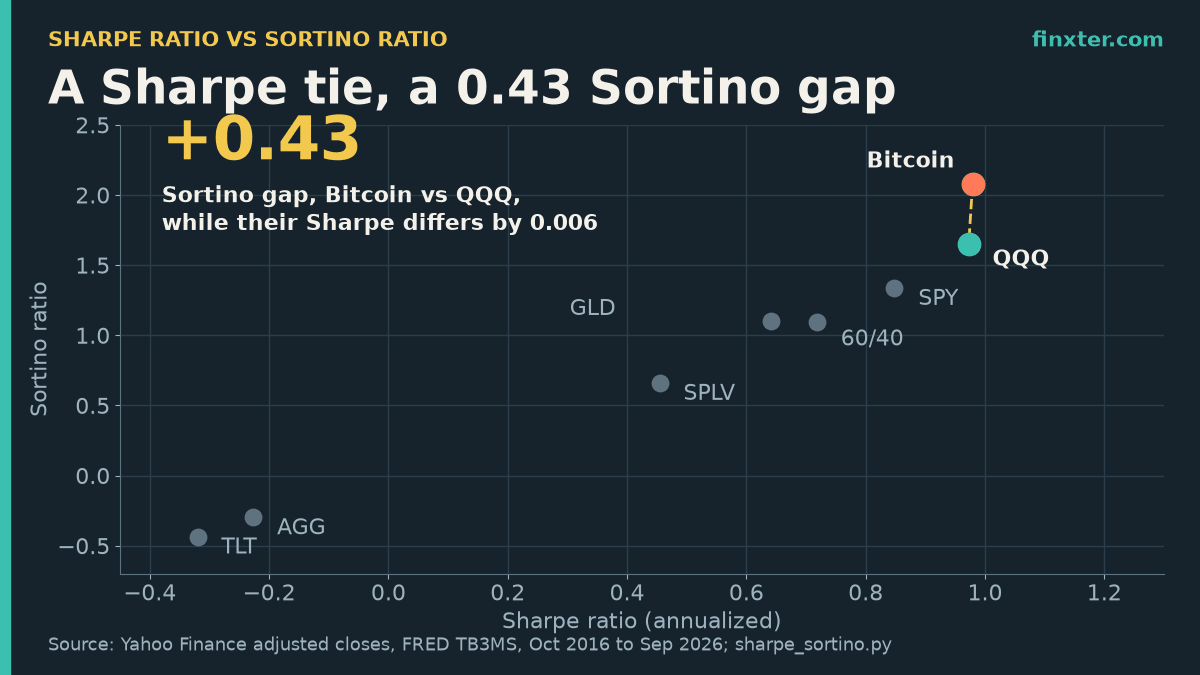
Sharpe ratio vs Sortino ratio in Python: Bitcoin and QQQ tied on Sharpe (0.98 vs 0.97) over 10 years, but Sortino scored them 2.08 vs 1.65. Here’s why.

How often to rebalance portfolio? Once a year: in a 40-year 60/40 Python backtest, 39 trades matched monthly’s 477 on Sharpe with a smaller drawdown.
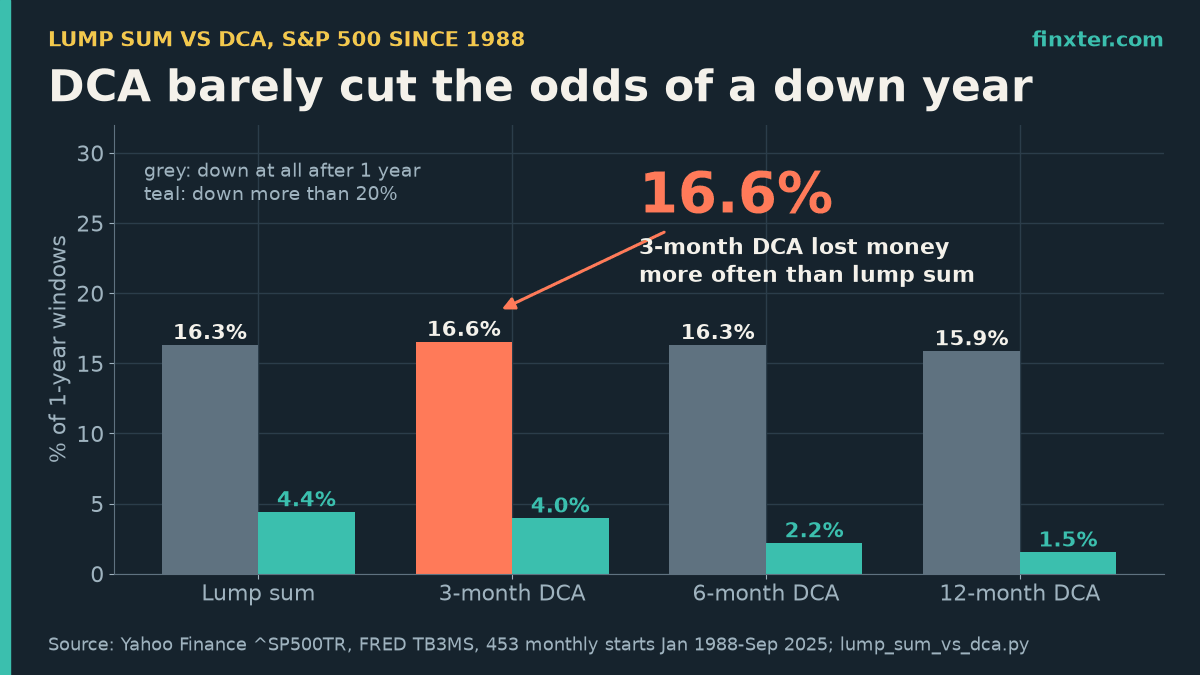
Lump sum vs DCA S&P 500 since 1988: lump sum won 65-78% of 453 start months, and DCA barely changed the odds of a losing year. Python script included.
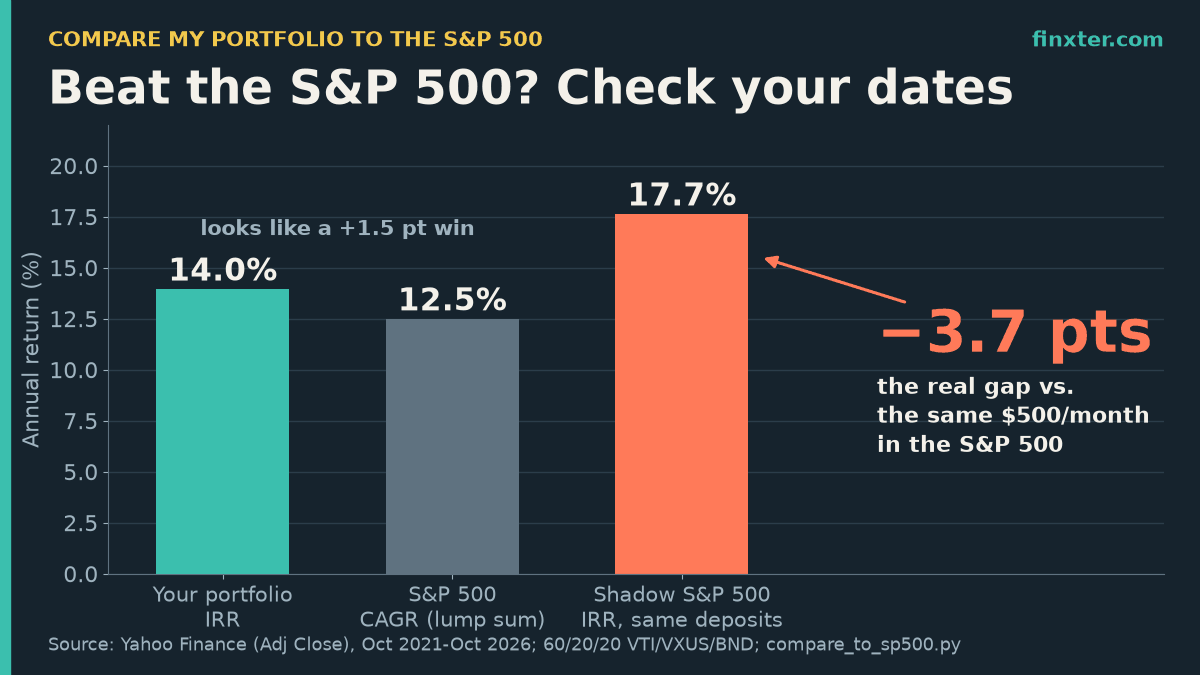
How to compare my portfolio to the S&P 500 the right way: a Python shadow benchmark on 5 years of real data turns a fake +1.5-point win into a 3.7-point loss.

My very limited time on X has already shown that posts ranked by number of expression is highly non-linear. Maybe Zipf or Pareto distributed? The first plot shows each post sorted by impressions (rank 1 = most impressions). You’ll see a steep drop from the top few posts, then a long tail of low-impression posts. … Read more
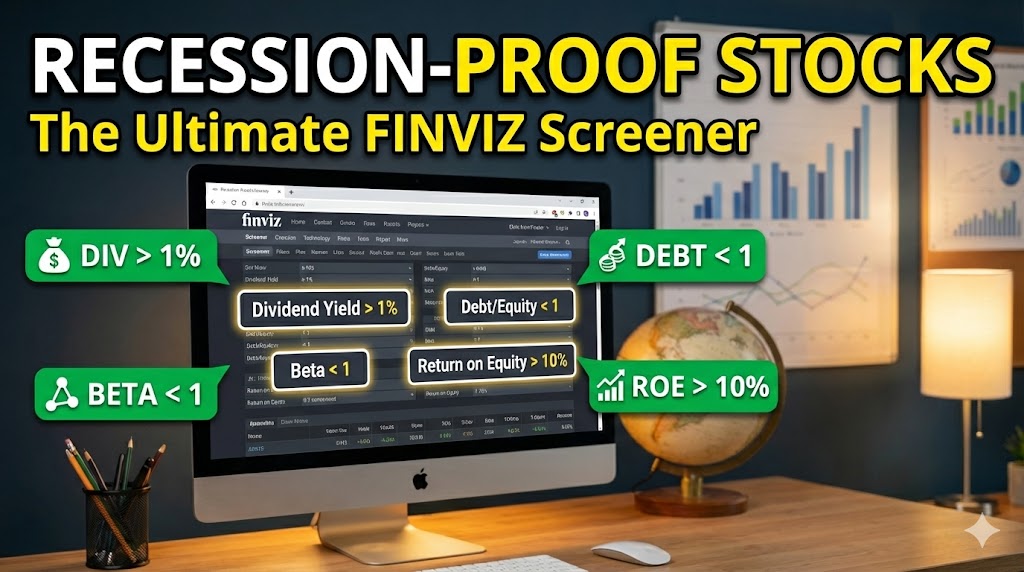
Disclaimer: This is not investment advice – just financial entertainment. TLDR: These are the four variables to screen to find recession proof stocks according to financial research (e.g., Morningstar) Here’s the video I recorded: What is a Recession? A recession is simply a broad, painful slowdown in the economy: falling output, jobs, incomes, production, and … Read more