
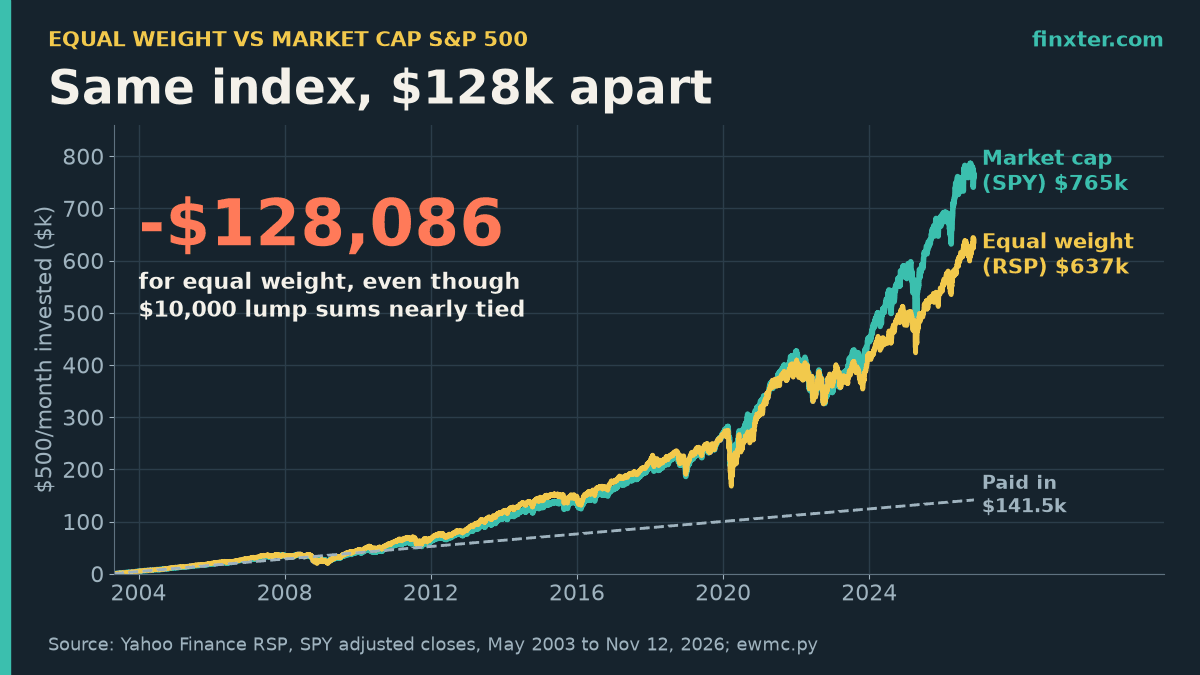
Put $10,000 into the equal-weight S&P 500 in May 2003 and today you’re within 2% of the classic market-cap S&P 500. Put $500 a month into it instead, and you’re $128,086 behind. Same 500 companies, same 23.5 years, and the result depends almost entirely on when your money went in.
Here is the short answer on equal weight vs market cap S&P 500 performance, using the two biggest ETFs with dividends reinvested: from May 1, 2003 to November 12, 2026, $10,000 in the Invesco S&P 500 Equal Weight ETF (RSP) grew to $124,203 (11.30% a year). The same $10,000 in the SPDR S&P 500 ETF (SPY) grew to $126,266 (11.38% a year). A near tie. But equal weight did its winning early, when a monthly investor had little money in, and its losing in 2023 to 2025, when that investor had the most.
I pulled every daily RSP and SPY close since RSP launched and ran the comparison the way real investors buy: lump sum, monthly contributions, rolling windows, calendar years and crashes. The full Python script is at the end.
TL;DR
- $10,000 from May 2003 to Nov 12, 2026: equal weight (RSP) $124,203 vs market cap (SPY) $126,266. A near tie: 11.30% vs 11.38% a year.
- $500 a month over the same span: RSP $636,793 vs SPY $764,878, a $128,086 gap from the same $141,500.
- Equal weight led monthly investors by $17,573 in January 2023, then trailed by 12.5 and 12.1 points in 2023 and 2024.
- Equal weight won 10 of 22 calendar years and 44% to 46% of rolling 1- to 10-year windows. It leads 2026 so far: +16.6% vs +11.9%.
- It fell more in 2008 and 2020, less in 2022. Python script included.
A side note on the monthly-investor math below: the single biggest input in any $500-a-month plan is the $500. If you want to raise it with a side income, one route is a small catalog of self-published ebooks on Amazon KDP. ImagineYourBook is an AI book-writing tool that turns a prompt or your notes into a complete text draft with a cover, exported as Word and EPUB, with series memory for Book Two and beyond. I run the royalty numbers in the closing section.
The scoreboard: lump sum vs monthly investing
| May 1, 2003 to Nov 12, 2026 | Equal weight (RSP) | Market cap (SPY) |
|---|---|---|
| $10,000 lump sum grew to | $124,203 | $126,266 |
| Return per year | 11.30% | 11.38% |
| $500/month ($141,500 paid in) grew to | $636,793 | $764,878 |
| Volatility (annualized) | 19.7% | 18.5% |
| Worst drawdown | -59.9% | -55.2% |
| Expense ratio | 0.20% | 0.09% |
Equal weight was slightly more volatile (19.7% vs 18.5%) and fell harder in the 2008 crash (-59.9% vs -55.2% at the bottom). Over the full window, its return was 0.08 points a year lower. That’s the lump-sum story most “equal weight vs market cap” charts tell, and it reads like a wash.
The monthly story is not a wash. Investing $500 on the first trading day of every month, $141,500 in total, ended at $764,878 in SPY and $636,793 in RSP. That’s a 17% smaller nest egg from the same contributions.
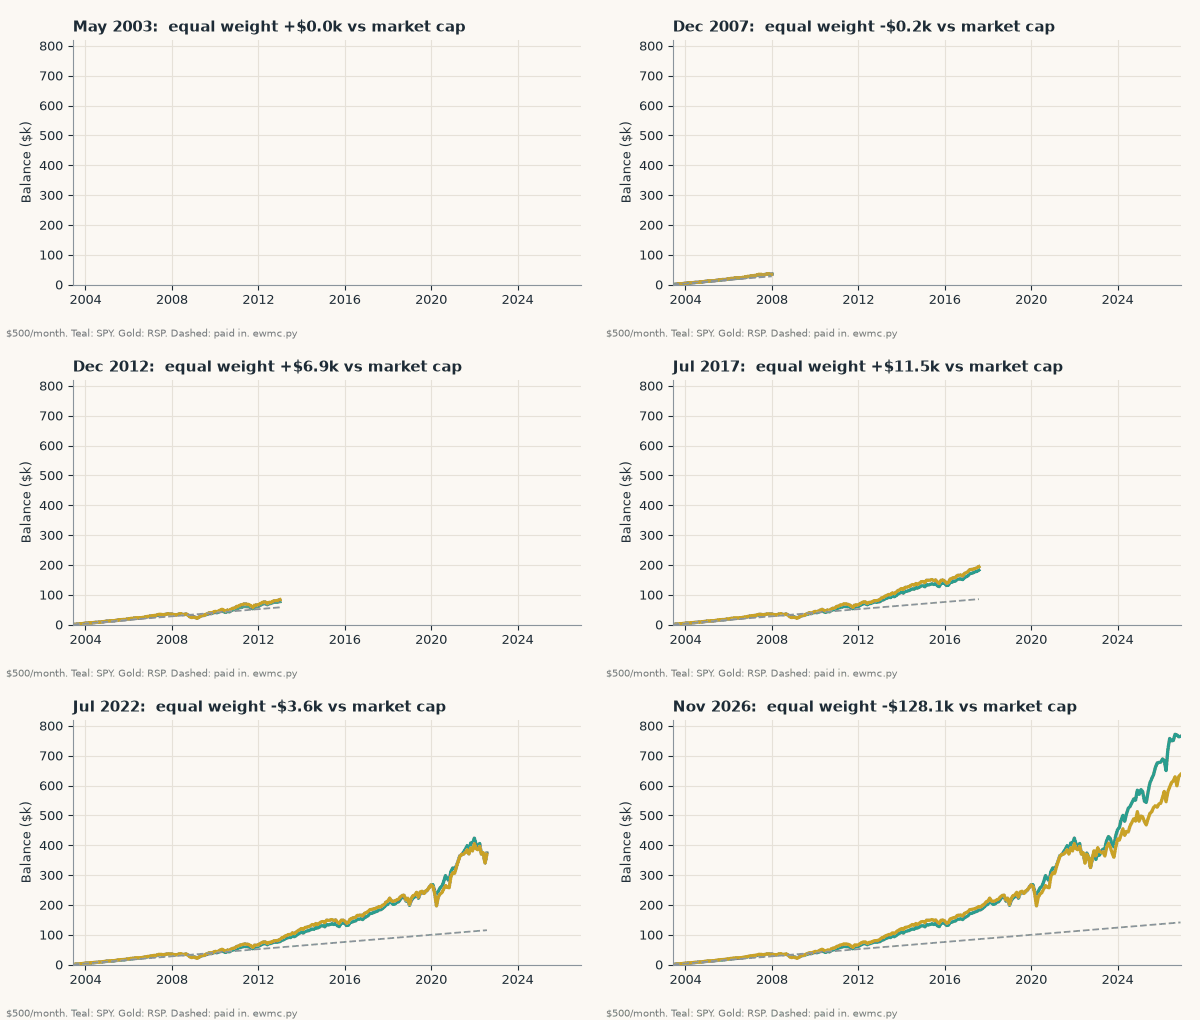
The animation shows why. Equal weight was ahead of market cap for monthly investors most of the time from 2004 to early 2023. Its biggest lead was $17,573 on January 12, 2023, on a balance of about $366,000. Then came three brutal years for equal weight: it trailed by 12.5 points in 2023, 12.1 points in 2024 and 6.5 points in 2025. Those losses hit the largest balance the investor ever had.
Equal weight’s 32% lead, and how it disappeared
The cleanest way to see the whole race is to divide RSP’s total return by SPY’s. Above 1.0, equal weight is ahead since 2003. Below 1.0, it’s behind.
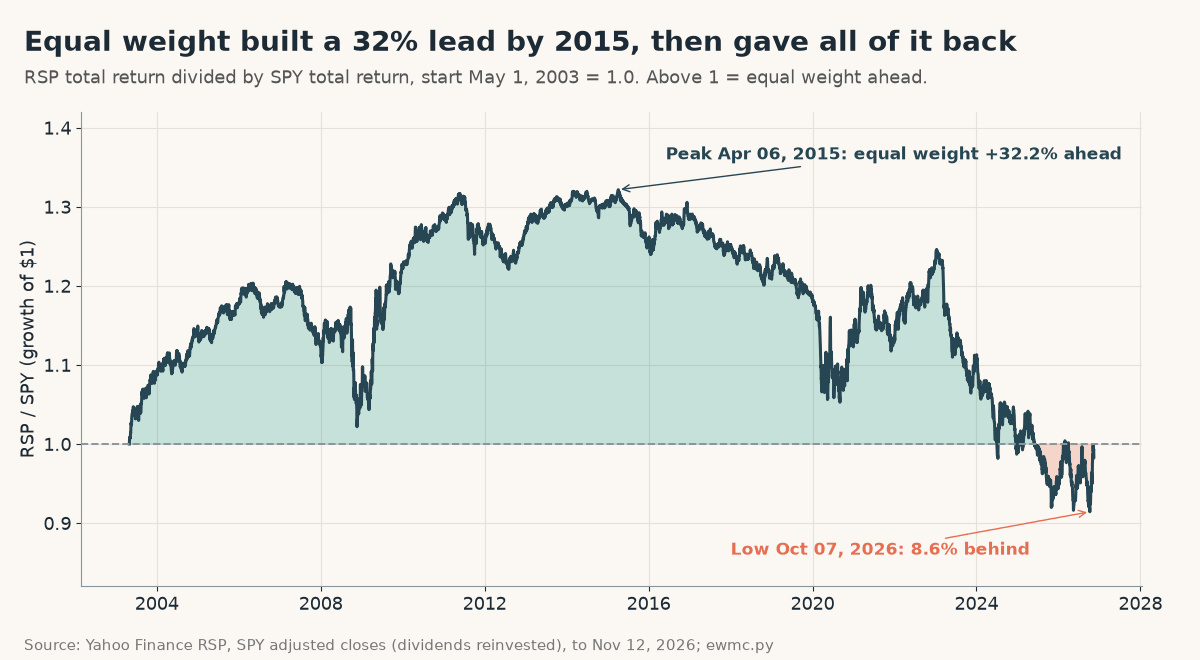
Equal weight built a 32.2% cumulative lead by April 6, 2015. Then it slowly gave it back, with a sharp drop in 2020 and a steep slide after early 2023. By October 7, 2026 it was 8.6% behind, the worst point since RSP launched. It has since clawed back to 1.6% behind.
Why the swing? The two funds own the same companies with very different weights. As of November 11, 2026, SPY’s top 10 holdings make up 36.89% of the fund, led by Apple (7.89%), NVIDIA (6.39%) and Microsoft (5.89%). RSP’s top 10 make up just 2.75% (Stock Analysis holdings data). S&P Dow Jones Indices sets each company to a fixed 0.2% at every quarterly rebalance. So equal weight is a bet on the average S&P 500 stock, and market cap is a bet on the biggest ones. When megacaps lead, as in 2023 and 2024, market cap wins by double digits.
Year by year: who won when
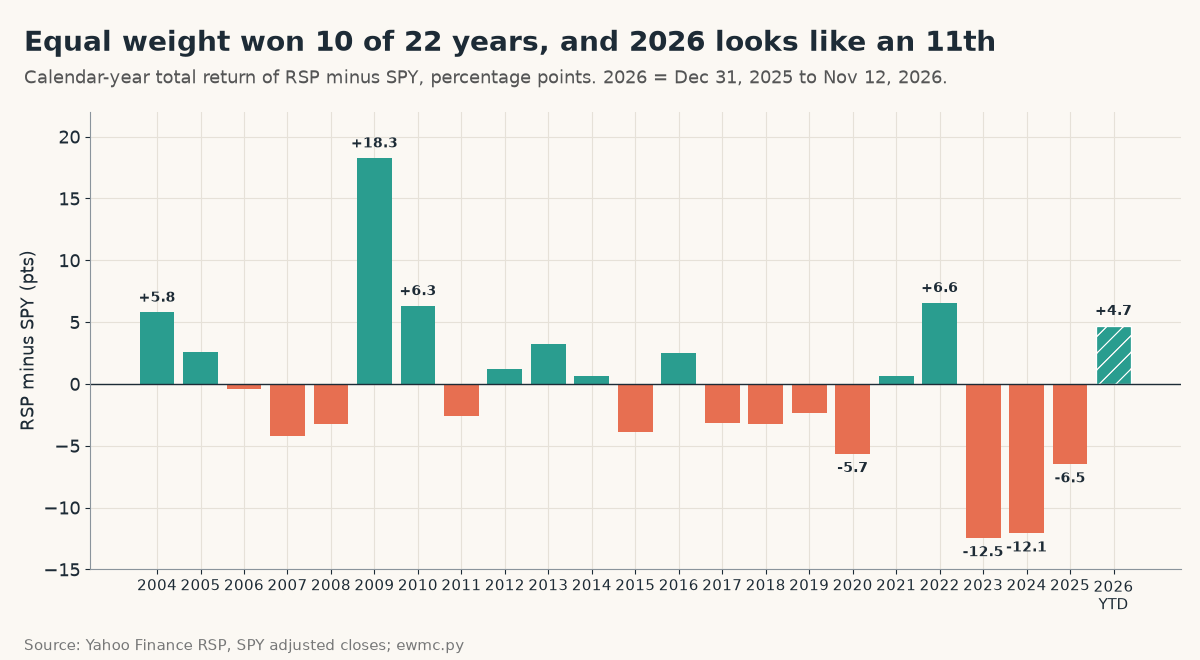
From 2004 to 2025, equal weight won 10 of 22 calendar years. Its best years came during and right after bear markets: +18.3 points in 2009, +6.3 in 2010 and +6.6 in 2022. Its worst came in megacap rallies: -12.5 in 2023, -12.1 in 2024 and -6.5 in 2025.
And 2026 is shaping up as an equal-weight year. From December 31, 2025 to November 12, 2026, RSP returned +16.6% vs +11.9% for SPY. Over the last 12 months, equal weight leads 17.93% to 11.99%.
The start date decides the “winner”
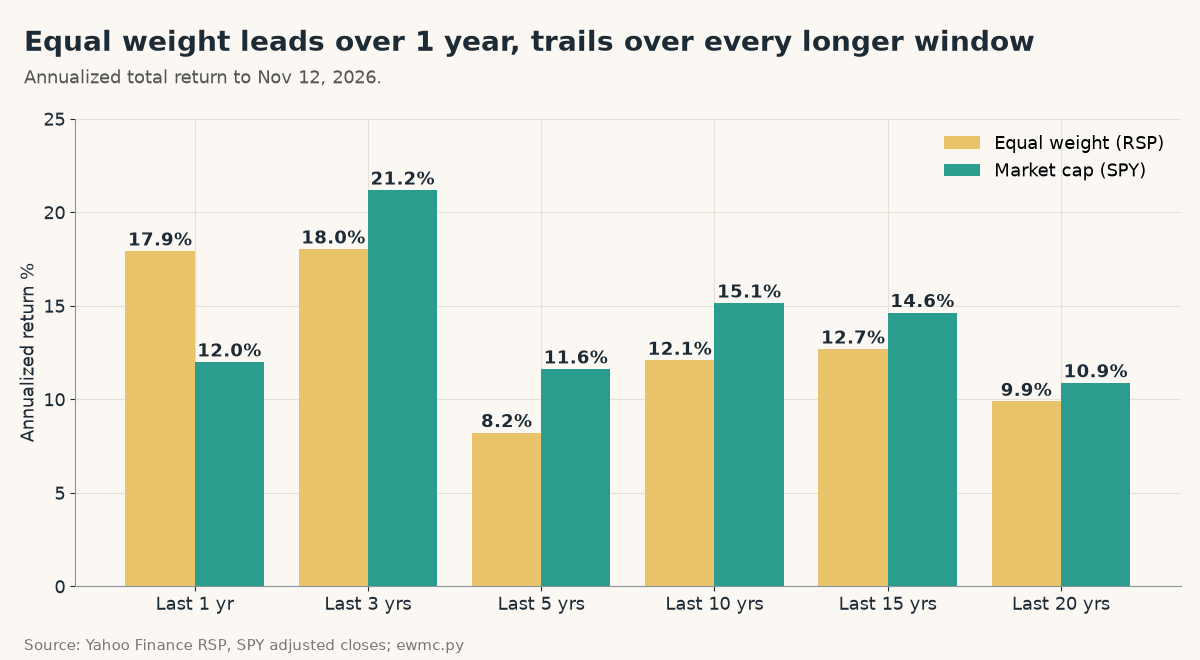
Equal weight leads over the last year and trails over every longer window to November 12, 2026: by 3.15 points a year over 3 years, 3.40 over 5, 3.06 over 10, 1.95 over 15 and 1.00 over 20. Start in May 2003, though, and it’s nearly even.
To remove the start-date cherry-picking, I checked every rolling window that starts at a month end:
| Holding period | Rolling windows tested | Equal weight won |
|---|---|---|
| 1 year | 271 | 45% |
| 3 years | 247 | 45% |
| 5 years | 223 | 44% |
| 10 years | 163 | 46% |
Equal weight beat market cap in 44% to 46% of windows at every holding period from 1 to 10 years. In other words: slightly worse than a coin flip, and holding longer did not make equal weight more reliable. The two funds’ monthly returns are 0.949 correlated, so they mostly move together. The gap comes from long stretches where one style is in favor.
Crashes: equal weight is not a defensive tilt
A common claim is that equal weight protects you because it holds less of the expensive megacaps. The data is mixed:
| Sell-off (peak to trough) | Equal weight (RSP) | Market cap (SPY) | Who fell less |
|---|---|---|---|
| Oct 9, 2007 to Mar 9, 2009 | -59.2% | -55.2% | Market cap |
| Feb 19 to Mar 23, 2020 | -39.0% | -33.7% | Market cap |
| Jan 3 to Oct 12, 2022 | -20.3% | -24.5% | Equal weight |
Equal weight fell more in the 2008 crash and in the 2020 Covid crash. It only held up better in 2022, when the megacaps led the market down. If you want a smoother ride, equal weight alone won’t give it to you. For real crash protection, the asset mix matters more; see our 60/40 portfolio max drawdown and gold vs S&P 500 last 20 years tests.
The takeaway: equal weight is a different bet (the average S&P 500 stock), not a better or safer one. Over 23.5 years it nearly tied on a lump sum, but its timing cost monthly investors 17% of their final balance.
Which should you own?
There is no free lunch in either direction. Practical takeaways from the numbers:
- Market cap is the default. SPY’s expense ratio is 0.09% vs 0.20% for RSP (Stock Analysis). Over 23.5 years the two still landed within 0.08 points a year, so the extra fee isn’t a dealbreaker, but it’s a drag you pay every year.
- Equal weight is a diversifier, not a replacement. If 36.89% in ten stocks makes you nervous, a slice of RSP lowers that concentration. A 50/50 split would put roughly 20% in SPY’s top 10.
- If you invest monthly, the order of returns matters. The lump-sum tie hid a $128,086 gap. This is the same effect behind sequence of returns risk, and it’s why our lump sum vs DCA test looks at both paths.
- Don’t chase the last 12 months. Equal weight leads 2026 by 4.7 points. It also led in 2021 and 2022, and then trailed by 12 points two years in a row.
- Rebalance on a schedule if you hold both. See how often to rebalance a portfolio for the cost of different schedules.
What this comparison leaves out
- Taxes and trading costs. Not modeled. ETF prices already include each fund’s expense ratio.
- Index vs ETF. I used the ETFs, not the indexes, because that’s what you can actually buy. RSP launched April 24, 2003, so the data starts May 1, 2003.
- One path of history. These are past results for one market. Nothing here predicts which style wins the next decade. Not investment advice.
The Python script
The script downloads RSP and SPY from Yahoo Finance via yfinance (cached to src/) and prints every number in this article. You need pip install yfinance pandas. New to pandas? Start with the Finxter pandas quickstart.
"""Equal weight vs market cap S&P 500 performance: RSP vs SPY, total return, 2003-2026.
pip install yfinance pandas"""
import os
import numpy as np, pandas as pd

END = "2026-11-12"  # last full close when this was run

def load(ticker):
    path = f"src/{ticker}.pkl"
    if os.path.exists(path):
        return pd.read_pickle(path)
    import yfinance as yf
    d = yf.download(ticker, start="2003-04-01", auto_adjust=False, progress=False)
    d.columns = [c[0] if isinstance(c, tuple) else c for c in d.columns]
    os.makedirs("src", exist_ok=True); d.to_pickle(path)
    return d

def data():
    # "Adj Close" = price with dividends reinvested (total return, net of fund fees)
    df = pd.DataFrame({"ew": load("RSP")["Adj Close"], "cw": load("SPY")["Adj Close"]}).dropna()
    return df.loc[:END]

def years(x): return (x.index[-1] - x.index[0]).days / 365.25
def cagr(x): return (x.iloc[-1] / x.iloc[0]) ** (1 / years(x)) - 1
def max_dd(x): return (x / x.cummax() - 1).min()
def vol(x): return x.pct_change().std() * np.sqrt(252)

def last(df, n):
    start = df.index[df.index <= df.index[-1] - pd.DateOffset(years=n)][-1]
    return df.loc[start:]

def win_rate(df, n_years):
    m = df.resample("ME").last(); k = 12 * n_years
    r = (m / m.shift(k)).dropna()
    return (r.ew > r.cw).mean(), len(r)

def dca_path(s, monthly=500):
    """Running balance of `monthly` dollars invested on the first trading day of each month."""
    first = s.groupby(s.index.to_period("M")).head(1)
    return (monthly / first).reindex(s.index).fillna(0).cumsum() * s

def dca(df, monthly=500):
    """Invest `monthly` dollars on the first trading day of each month."""
    first = df.groupby(df.index.to_period("M")).head(1)
    units = (monthly / first).sum()
    return units * df.iloc[-1], monthly * len(first)

if __name__ == "__main__":
    df = data()
    print(f"window {df.index[0]:%Y-%m-%d} .. {df.index[-1]:%Y-%m-%d} ({years(df):.1f} yrs)")
    for col, name in (("ew", "RSP equal weight"), ("cw", "SPY market cap ")):
        x = df[col]
        print(f"{name} $10,000 -> ${1e4 * x.iloc[-1] / x.iloc[0]:>7,.0f}  CAGR {cagr(x):6.2%}  "
              f"vol {vol(x):5.1%}  max drawdown {max_dd(x):6.1%}")
    rel = df.ew / df.cw; rel = rel / rel.iloc[0]
    pk = rel.idxmax()
    print(f"relative (RSP/SPY) peak {pk:%Y-%m-%d} at {rel[pk]:.3f}; low since then {rel[pk:].min():.3f} on {rel[pk:].idxmin():%Y-%m-%d}; now {rel.iloc[-1]:.3f}")
    for n in (1, 3, 5, 10, 15, 20):
        x = last(df, n); print(f"last {n:2d} yrs: RSP {cagr(x.ew):6.2%}  SPY {cagr(x.cw):6.2%}  gap {cagr(x.ew)-cagr(x.cw):+.2%}")
    for n in (1, 3, 5, 10):
        p, cnt = win_rate(df, n); print(f"RSP beat SPY in {p:.0%} of {cnt} rolling {n}-yr windows")
    yr = df.resample("YE").last().pct_change().loc["2004":"2025"]
    print(f"calendar years 2004-2025: RSP won {(yr.ew > yr.cw).sum()} of {len(yr)}")
    for d, r in yr.iterrows():
        print(f"  {d.year}: RSP {r.ew:+6.1%}  SPY {r.cw:+6.1%}  gap {r.ew - r.cw:+6.1%}")
    ytd = df.loc["2025-12-31":]; ytd = ytd.iloc[-1] / ytd.iloc[0] - 1
    print(f"2026 YTD: RSP {ytd.ew:+.1%}  SPY {ytd.cw:+.1%}")
    for a, b, lab in (("2007-10-09", "2009-03-09", "GFC peak-to-trough"), ("2020-02-19", "2020-03-23", "Covid crash"),
                      ("2022-01-03", "2022-10-12", "2022 bear market")):
        s = df.loc[a:b]; r = s.iloc[-1] / s.iloc[0] - 1
        print(f"{lab}: RSP {r.ew:+.1%}  SPY {r.cw:+.1%}")
    for col in ("ew", "cw"):
        v, paid = dca(df[col]); print(f"$500/month DCA into {col.upper()}: paid ${paid:,.0f} -> ${v:,.0f}")
    lead = dca_path(df.ew) - dca_path(df.cw)
    print(f"equal weight's biggest $500/month lead: ${lead.max():,.0f} on {lead.idxmax():%Y-%m-%d}; now ${lead.iloc[-1]:,.0f}")
    # Side-income napkin: KDP 70% royalty on a $4.99 ebook minus $0.06 average delivery (KDP help page)
    royalty = 0.70 * 4.99 - 0.06; side = 30 * royalty  # assumption: 30 sales a month across a small catalog
    w10 = last(df, 10)
    for col in ("ew", "cw"):
        v, paid = dca(w10[col], side); print(f"last 10 yrs, ${side:.2f}/month of royalties into {col.upper()}: paid ${paid:,.0f} -> ${v:,.0f}")
    print(f"royalty per $4.99 sale ${royalty:.2f}; 30 sales/month = ${side:.2f}")
    m = df.resample("ME").last().pct_change().dropna()
    print(f"monthly return correlation RSP vs SPY: {m.ew.corr(m.cw):.3f}")
Output (run November 13, 2026, using closes through November 12):
window 2003-05-01 .. 2026-11-12 (23.5 yrs)
RSP equal weight $10,000 -> $124,203  CAGR 11.30%  vol 19.7%  max drawdown -59.9%
SPY market cap  $10,000 -> $126,266  CAGR 11.38%  vol 18.5%  max drawdown -55.2%
relative (RSP/SPY) peak 2015-04-06 at 1.322; low since then 0.914 on 2026-10-07; now 0.984
last  1 yrs: RSP 17.93%  SPY 11.99%  gap +5.93%
last  3 yrs: RSP 18.03%  SPY 21.18%  gap -3.15%
last  5 yrs: RSP  8.22%  SPY 11.62%  gap -3.40%
last 10 yrs: RSP 12.08%  SPY 15.14%  gap -3.06%
last 15 yrs: RSP 12.68%  SPY 14.64%  gap -1.95%
last 20 yrs: RSP  9.88%  SPY 10.88%  gap -1.00%
RSP beat SPY in 45% of 271 rolling 1-yr windows
RSP beat SPY in 45% of 247 rolling 3-yr windows
RSP beat SPY in 44% of 223 rolling 5-yr windows
RSP beat SPY in 46% of 163 rolling 10-yr windows
calendar years 2004-2025: RSP won 10 of 22
  2004: RSP +16.5%  SPY +10.7%  gap  +5.8%
  2005: RSP  +7.4%  SPY  +4.8%  gap  +2.6%
  2006: RSP +15.5%  SPY +15.8%  gap  -0.4%
  2007: RSP  +0.9%  SPY  +5.1%  gap  -4.2%
  2008: RSP -40.1%  SPY -36.8%  gap  -3.3%
  2009: RSP +44.6%  SPY +26.4%  gap +18.3%
  2010: RSP +21.4%  SPY +15.1%  gap  +6.3%
  2011: RSP  -0.7%  SPY  +1.9%  gap  -2.6%
  2012: RSP +17.2%  SPY +16.0%  gap  +1.2%
  2013: RSP +35.5%  SPY +32.3%  gap  +3.2%
  2014: RSP +14.1%  SPY +13.5%  gap  +0.6%
  2015: RSP  -2.7%  SPY  +1.2%  gap  -3.9%
  2016: RSP +14.5%  SPY +12.0%  gap  +2.5%
  2017: RSP +18.5%  SPY +21.7%  gap  -3.2%
  2018: RSP  -7.8%  SPY  -4.6%  gap  -3.3%
  2019: RSP +28.9%  SPY +31.2%  gap  -2.3%
  2020: RSP +12.7%  SPY +18.3%  gap  -5.7%
  2021: RSP +29.4%  SPY +28.7%  gap  +0.7%
  2022: RSP -11.6%  SPY -18.2%  gap  +6.6%
  2023: RSP +13.7%  SPY +26.2%  gap -12.5%
  2024: RSP +12.8%  SPY +24.9%  gap -12.1%
  2025: RSP +11.2%  SPY +17.7%  gap  -6.5%
2026 YTD: RSP +16.6%  SPY +11.9%
GFC peak-to-trough: RSP -59.2%  SPY -55.2%
Covid crash: RSP -39.0%  SPY -33.7%
2022 bear market: RSP -20.3%  SPY -24.5%
$500/month DCA into EW: paid $141,500 -> $636,793
$500/month DCA into CW: paid $141,500 -> $764,878
equal weight's biggest $500/month lead: $17,573 on 2023-01-12; now $-128,086
last 10 yrs, $102.99/month of royalties into EW: paid $12,462 -> $23,499
last 10 yrs, $102.99/month of royalties into CW: paid $12,462 -> $27,700
royalty per $4.99 sale $3.43; 30 sales/month = $102.99
monthly return correlation RSP vs SPY: 0.949
To see how your own buys stack up against the S&P 500, with your real dates and amounts, PortfolioTracker24 is a free private tracker that runs in your browser: no account, no broker connection, trades stay in your browser, and it keeps Excel backups. For a Python version of that check, see compare my portfolio to the S&P 500.
FAQ
Has equal weight outperformed market cap S&P 500?
Barely not. From May 2003 to November 12, 2026, $10,000 in RSP grew to $124,203 (11.30% a year) and in SPY to $126,266 (11.38%). Equal weight leads over the last year but trails over 3, 5, 10, 15 and 20 years.
Why did equal weight lag so much in 2023 and 2024?
Those rallies were led by the largest companies. SPY's top 10 holdings are 36.89% of the fund versus 2.75% for RSP, so when megacaps surge, market cap wins. RSP trailed by 12.5 points in 2023 and 12.1 in 2024.
Is equal weight safer in a crash?
Not reliably. Equal weight fell 59.2% vs 55.2% in 2007 to 2009 and 39.0% vs 33.7% in the 2020 crash. It held up better only in 2022 (-20.3% vs -24.5%), when megacaps led the decline.
Is RSP better than SPY for monthly investing?
It was worse in this sample. $500 a month from May 2003 grew to $636,793 in RSP vs $764,878 in SPY, because equal weight's strongest years came early, when the balance was small. Past results don't predict future ones.
How often does equal weight beat the S&P 500?
In 44% to 46% of rolling windows from 1 to 10 years since 2003, and in 10 of 22 calendar years from 2004 to 2025. Holding longer did not raise the win rate.
Bottom line: the contribution beats the index choice
Equal weight vs market cap S&P 500 performance came out nearly even for a 2003 lump sum ($124,203 vs $126,266) and $128,086 apart for a monthly investor, because equal weight’s good years came when the balance was small. If you can’t predict which style leads next, the lever you do control is how much you add each month.
Here’s the napkin math on growing that lever with ebooks. KDP’s 70% royalty option pays 70% of the list price minus delivery costs, which average $0.06 per unit (KDP eBook Royalties help page). On a $4.99 ebook that’s $3.43 per sale. Assumption, not a promise: a small catalog selling 30 copies a month across all titles earns $102.99 a month. Invested on the first trading day of every month over the last 10 years, that $12,462 of royalties would have grown to $27,700 in SPY or $23,499 in RSP, using the same data and script as above. Many self-published books sell far fewer copies, so treat 30 a month as a target to test, not a baseline.
If you want to try that route, ImagineYourBook can turn an idea or your notes into a full text draft with a cover, ready to edit and publish on KDP. The 7-day trial is $0 with a card and includes one 10,000-word book; if you don’t cancel before day 8, the first charge is $24.99 a month. You still do the editing, the fact check and the marketing.
Sources (checked November 13, 2026): Yahoo Finance: RSP history · Yahoo Finance: SPY history · yfinance on GitHub · Stock Analysis: RSP expense ratio, inception, top 10 weight · Stock Analysis: SPY holdings (Nov 11, 2026) · S&P Dow Jones Indices: S&P 500 Equal Weight Index methodology summary · Amazon KDP: eBook Royalties · ImagineYourBook pricing and trial terms · PortfolioTracker24. Script: ewmc.py (shown above). Past returns don’t predict future returns. Not investment advice.