
Problem Formulation and Solution Overview
ℹ️ Python offers numerous ways to generate a PDF file. One option is to use the ReportLab library. The article selected the path that used the least amount of code.
To make it more interesting, we have the following running scenario:
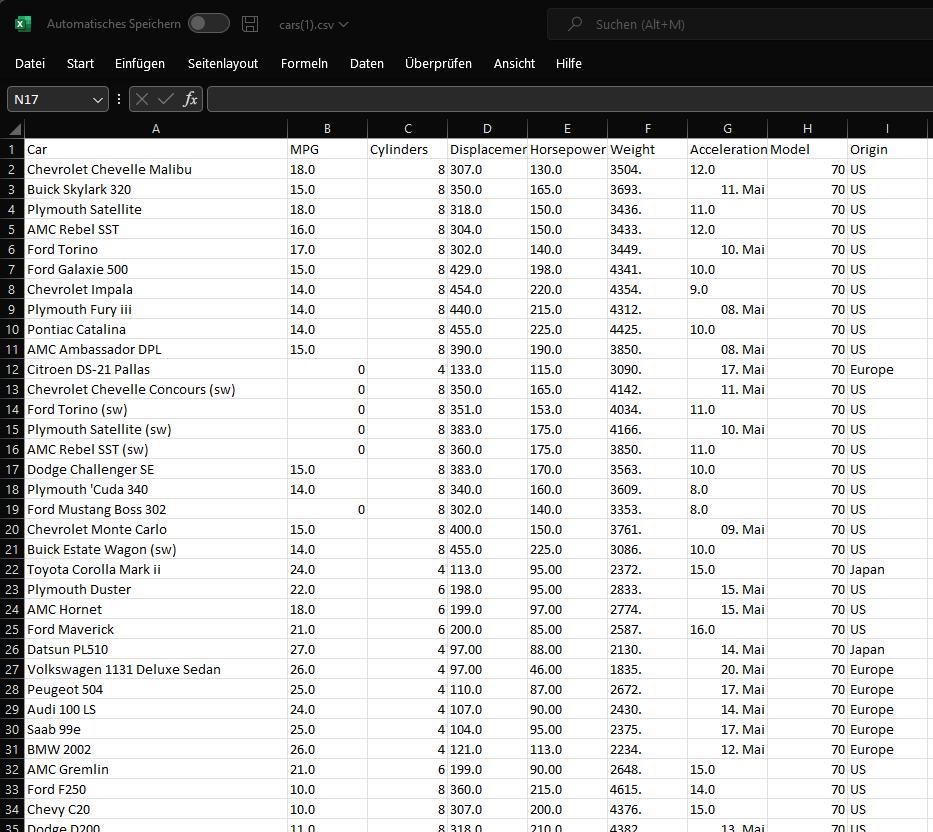
To follow along with this article, download and place the cars.csv file into the current working directory:
Download and save the logo file to the current working directory as car_logo.png.
- Install
ReportLabPandas - Add Library References
- Read CSV File
- Calculate Total Pages
- Get Stylesheet and Template
- Create Page Header
- Paginate the Data
- Build the PDF
- Generate the PDF
Step 1: Install ReportLab and Pandas Libraries
Before moving forward, the ReportLabPandas libraries must be installed. To install these libraries, run the following code at the command prompt.
The ReportLabPandas library is required to read and manipulate the cars.csv file.
pip install reportlab
pip install pandas
Step 2: Add Library References
To run this code error-free, references to the required modules must be added.
To add these references, navigate to the IDE. Create a file called pdf.py and place this file into the current working directory.
Copy the code snippet below and paste this code into the above-created file.
from reportlab.platypus import *
from reportlab.lib.styles import *
from reportlab.lib import *
from reportlab.platypus import *
import pandas as pd
import math
An alternate option would be to reference precisely what is needed.
from reportlab.lib.styles import getSampleStyleSheet
from reportlab.platypus import PageBreak
from reportlab.platypus import SimpleDocTemplate, Table, PageBreak, Image, Paragraph, Spacer
from reportlab.lib import colors
import pandas as pd
import math
The first option is much cleaner. There are pros and cons for each selection. However, the choice is up to you.
Save this file.
Step 3: Read CSV File
The next step is to read the CSV file and extract the heading row.
Copy and paste this code snippet to the bottom of the pdf.py file.
df_cars = pd.read_csv('cars.csv', sep=';').head(60)
df_data = [df_cars.columns[:,].values.astype(str).tolist()] + df_cars.values.tolist()
pg_data = df_data[1:]
The first line in the above code snippet reads in the first 60 rows (head(60)) of the cars.csv file. In this file, the field separator character is a semi-colon (;) and must be specified, as read_csv() assumes the separator character is a comma (,). The results save to df_cars.
The following line casts all data types to strings astype(str) and splits the data into lists. The result saves to df_data. If output to the terminal, the data would display as shown below (a snippet of the file).
[['Car', 'MPG', 'Cylinders', 'Displacement', 'Horsepower', 'Weight', 'Acceleration', 'Model', 'Origin'],['Chevrolet Chevelle Malibu', 18.0, 8, 307.0, 130.0, 3504.0, 12.0, 70, 'US'],['Buick Skylark 320', 15.0, 8, 350.0, 165.0, 3693.0, 11.5, 70, 'US'],['Plymouth Satellite', 18.0, 8, 318.0, 150.0, 3436.0, 11.0, 70, 'US'], ...]
The last line removes the header row using slicing, leaving only the data. The results save to pg_data. If output to the terminal, the data would display as shown below (a snippet of the file).
[['Chevrolet Chevelle Malibu', 18.0, 8, 307.0, 130.0, 3504.0, 12.0, 70, 'US'], ['Buick Skylark 320', 15.0, 8, 350.0, 165.0, 3693.0, 11.5, 70, 'US'], ['Plymouth Satellite', 18.0, 8, 318.0, 150.0, 3436.0, 11.0, 70, 'US'], ['AMC Rebel SST', 16.0, 8, 304.0, 150.0, 3433.0, 12.0, 70, 'US'], ...]Save this file.
Step 4: Calculate Total Pages
This code snippet is used to calculate how many pages the PDF will be.
elements = []
recs_pg = 39
tot_pgs = math.ceil(len(df_data) / recs_pg)
The first line in the above code snippet declares an empty list called elements. This list will hold all the page formatting for the PDF.
The following line declares how many records per page will display (not including the header row). The results save to recs_pg.
The last line uses the ceil() function from the math library to calculate how many pages this PDF will be. This function returns an integer value. The results save to tot_pgs. If output to the terminal, the following will display.
2Save this file.
Step 5: Get Stylesheet and Template
This code snippet is used to set the styles and a template for the PDF.
styles = getSampleStyleSheet()
doc = SimpleDocTemplate('inventory.pdf', rightMargin=0, leftMargin=0, topMargin=0, bottomMargin=0)
The first line in the above code snippet gets the getSampleStyleSheet() function. This function gives us access to default styles, such as Title, Heading1, Heading2, etc. Additional styles can be found here.
The following line calls the SimpleDocTemplate() function and passes it five (5) arguments: the filename of the PDF to generate and the page margins. The results save to doc.
Save this file.
Step 6: Create Page Header
This code snippet creates a header for each page of the PDF.
def createPageHeader():
    elements.append(Spacer(1, 10))
    elements.append(Image('car_logo.png', 100, 25))
    elements.append(Paragraph("Inventory", styles['Title']))
    elements.append(Spacer(1, 8))
This first line in the above code snippet declares the function createPageHeader(). The contents of this function will appear at the top of each page.
The following line adds spacing from the top of the page using the Spacer() function and passing it two (2) arguments: the width and height. The results are appended to elements, declared at the beginning of the code.
💡To achieve the offset, the topMargin argument could also be adjusted. However, we wanted to show another way to achieve the same result.
The next line calls the Image() function and passes it three (3) arguments: the image, and the x and y positions, respectively.
The results are appended to elements, declared at the beginning of the code.
Then, a heading of Inventory is called using the Paragraph() function and passing it two (2) arguments: the text and the style for the text. The results are appended to elements, declared at the beginning of the code.
The last line appends another Spacer().
Save this file.
Step 7: Paginate the Data
This code snippet shows how the data for each page is paginated.
def paginateInventory(start, stop):
    tbl = Table(df_data[0:1] + pg_data[start:stop])
    tbl.setStyle(TableStyle([('BACKGROUND', (0, 0), (-1, 0), '#F5F5F5'),
                              ('FONTSIZE', (0, 0), (-1, 0), 8),
                              ('GRID', (0, 0), (-1, -1), .5, '#a7a5a5')]))
    elements.append(tbl)
The line in the above code snippet declares the function paginateInventory() which accepts two (2) arguments: a start and stop position.
The following line creates the data for the page. The Table() function is called and passed one (1) argument: the header row from df_data (df_data[0:1]), plus the data for the specified page (pg_data[start:stop]). These results save to tbl.
The next line sets out the format for the table on the page. This line does the following:
- Change the background color of the header row.
- Changes the font size.
- Sets up the grid lines between all the cols/rows,
The tbl is then appended to elements, declared at the beginning of the code.
Save this file.
Step 8: Build the PDF
This code snippet creates a function to loop through the paginated data and builds a PDF.
def generatePDF():
    cur_pg = 0
    start_pos = 0
    stop_pos = recs_pg

    for cur_pg in range(tot_pgs):
        createPageHeader()
        paginateInventory(start_pos, stop_pos)
        elements.append(PageBreak())
        start_pos += recs_pg
        stop_pos += recs_pg
    doc.build(elements)
The first line in the above code snippet declares the function generatePDF().
The following three (3) lines declare three (3) variables and their initial positions.
cur_pg, which keeps track of the page we are currently on.start_pos, which is where the data initially starts.stop_pos, which is where the data initially ends (recs_pg, or 39).
The following section does all the work! It declares a for loop, which loops through all pre-determined pages (tot_pgs, or 2 in this case). Then, the following creates a page by:
- Executing the
createPageHeader()function. - Outputting the page data using slicing (
paginateInventory(start_pos, stop_pos)). - Adds a Page Break (
PageBreak()). - Re-calculate the
start_posandstop_posvariables.
This loop continues until all pages have been generated,
The last line in this code snippet, builds the PDF.
Save this file.
Step 9: Generate a PDF
This code snippet generates the PDF built earlier.
If you ran the above code, no PDF file would be generated. This is because the following code needs to be appended to the end of the pdf.py file.
The first line is mainly used to declare the top-level starting point of a program.
if __name__ == '__main__':
    generatePDF()
An alternative is to just call the function.
generatePDF()
There are pros and cons to both options. However, the choice is up to you.
Save and run this file.
If successful, the inventory.pdf file will be saved to the current working directory.

The Full Code
from reportlab.platypus import *
from reportlab.lib.styles import *
from reportlab.lib import *
from reportlab.platypus import *
import pandas as pd
import math

df_cars = pd.read_csv('cars.csv', sep=';').head(60)
df_data = [df_cars.columns[:,].values.astype(str).tolist()] + df_cars.values.tolist()
pg_data = df_data[1:]

elements = []
recs_pg = 39
tot_pgs = math.ceil(len(df_data) / recs_pg)

styles = getSampleStyleSheet()
doc = SimpleDocTemplate('inventory.pdf', rightMargin=0, leftMargin=0, topMargin=0, bottomMargin=0)

def createPageHeader():
    elements.append(Spacer(1, 10))
    elements.append(Image('car_logo.png', 100, 25))
    elements.append(Paragraph("Inventory", styles['Title']))
    elements.append(Spacer(1, 8))

def paginateInventory(start, stop):
    tbl = Table(df_data[0:1] + pg_data[start:stop])
    tbl.setStyle(TableStyle([('BACKGROUND', (0, 0), (-1, 0), '#F5F5F5'),
                              ('FONTSIZE', (0, 0), (-1, 0), 8),
                              ('GRID', (0, 0), (-1, -1), .5, '#a7a5a5')]))
    elements.append(tbl)

def generatePDF():
    cur_pg = 0
    start_pos = 0
    stop_pos = recs_pg

    for cur_pg in range(tot_pgs):
        createPageHeader()
        paginateInventory(start_pos, stop_pos)
        elements.append(PageBreak())
        start_pos += recs_pg
        stop_pos += recs_pg
    doc.build(elements)
generatePDF()
Summary
This article has shown you a compact way to generate a customized PDF file.
Good Luck & Happy Coding!