
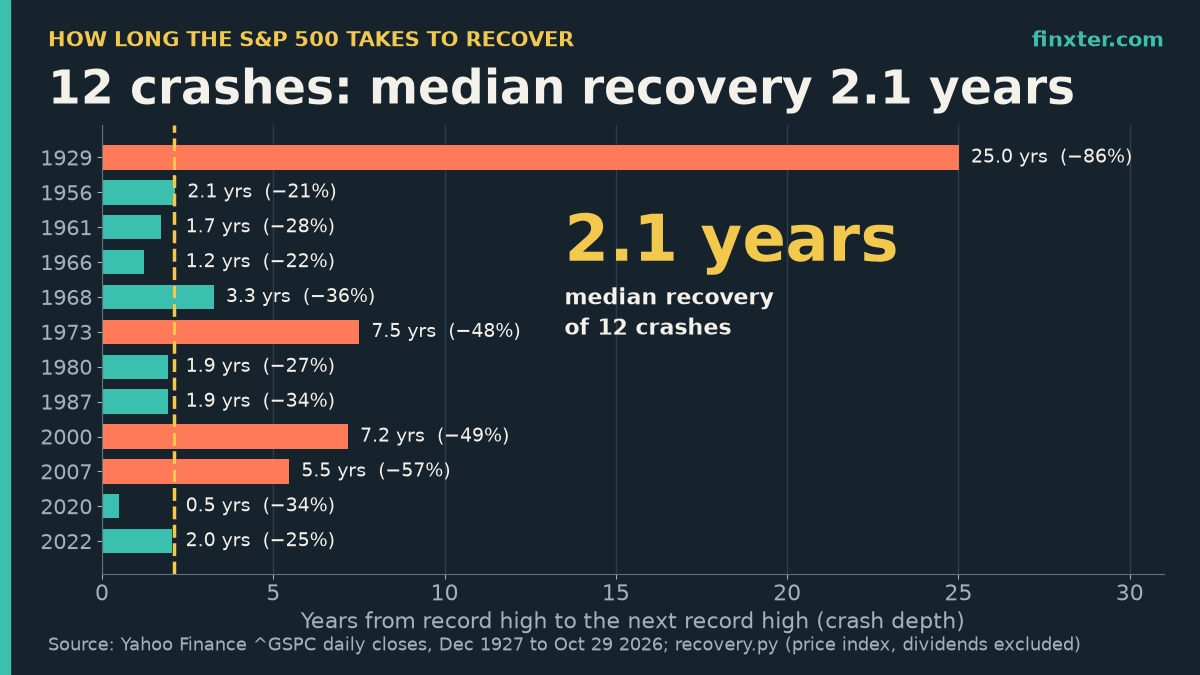
How long does it take the stock market to recover from a crash? For the S&P 500, the typical answer is about two years: across all 12 declines of 20% or more since 1928, the median time from the old record high to a new record high was 2.1 years. The spread around that median is huge, though. The fastest recovery (2020) took 0.5 years, and the slowest (1929) took 25.0 years on the price index alone.
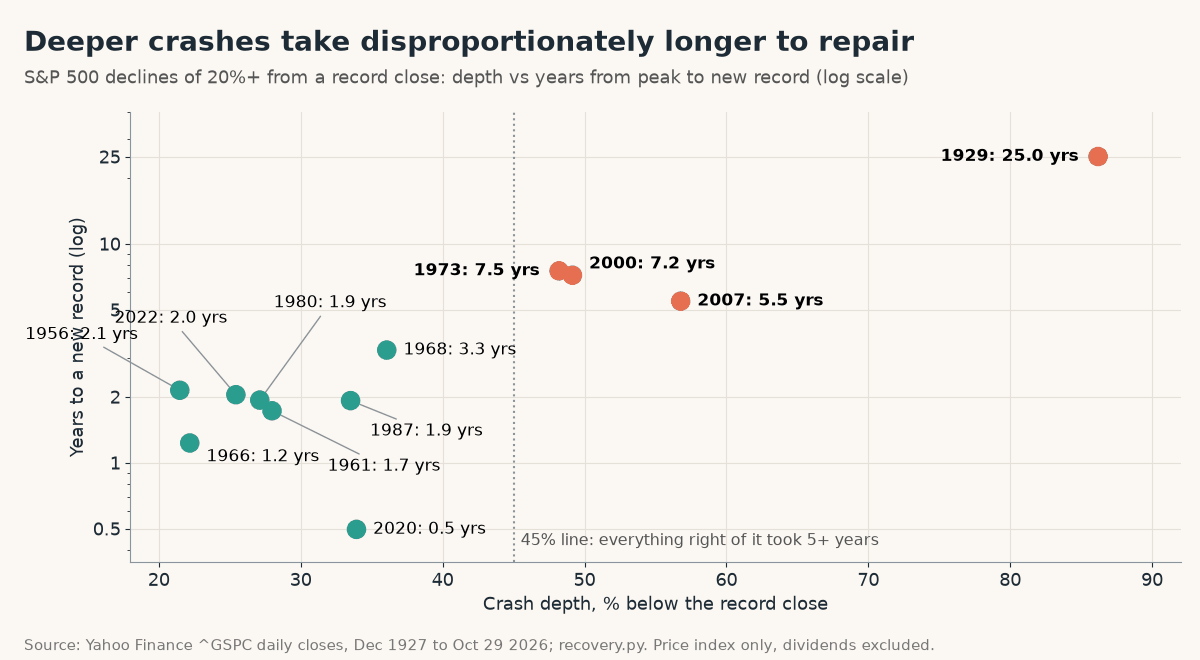
I measured every crash from daily closing prices with a short pandas script, which is included below so you can rerun it on any index or fund. The main pattern: how deep a crash goes tells you more about the wait than anything else. The four crashes that took five or more years to recover all fell 48% or more. Every crash shallower than 40% was back at a record within 3.3 years.
(If you end up with a sharp investing framework of your own, an AI book-writing tool like ImagineYourBook can turn your notes into a draft finance ebook or lead magnet with Word and EPUB export. More on that at the end.)
TL;DR
- Across all 12 S&P 500 crashes of 20%+ since 1928, the median time from record high to a new record was 2.1 years (2.0 years since 1946).
- From the bottom, the median climb back to the old high took 1.5 years.
- Depth decides the wait: every crash shallower than 40% recovered within 3.3 years; the four that fell 48%+ took 5.5 to 25 years.
- Corrections of 10–20% (14 of them) took a median 7 months to reach a new high.
- Dividends cut the infamous 1929 wait from 25.0 to 15.3 years (7.2 after inflation). Pandas script included.
How I measured “recovery”
“Recovered” can mean three different things, and articles on this question often mix them up. Here is the definition I used, kept strict:
- Crash: the S&P 500 closes at least 20% below its all-time closing high.
- Peak: the last record close before the drop.
- Trough: the lowest close before the index makes a new record.
- Recovered: the first close at or above the old record.
The data is the S&P 500 price index (^GSPC) from Yahoo Finance, daily closes from December 30, 1927 to October 29, 2026, loaded with yfinance. The finding itself is a cummax() one-liner: divide the price by its running maximum, and every value below 1.0 is time spent “under water.”
One consequence of measuring from all-time highs: a slump that happens while the market is still below an older record counts as part of the bigger episode, not as a separate crash. The 1937–38 slide (−54.5% from its March 1937 high) sits inside the 1929 recovery, and 2011’s −19.4% dip came while the index was still below its 2007 record. If you count every bear market from its own local peak, you get more episodes and shorter typical waits.
All 12 S&P 500 crashes since 1928
| Record high | Trough | New record | Depth | Peak → trough (yrs) | Trough → old high (yrs) | Peak → new high (yrs) |
|---|---|---|---|---|---|---|
| Sep 16, 1929 | Jun 01, 1932 | Sep 22, 1954 | −86.2% | 2.7 | 22.3 | 25.0 |
| Aug 03, 1956 | Oct 22, 1957 | Sep 24, 1958 | −21.5% | 1.2 | 0.9 | 2.1 |
| Dec 12, 1961 | Jun 26, 1962 | Sep 03, 1963 | −28.0% | 0.5 | 1.2 | 1.7 |
| Feb 09, 1966 | Oct 07, 1966 | May 04, 1967 | −22.2% | 0.7 | 0.6 | 1.2 |
| Nov 29, 1968 | May 26, 1970 | Mar 06, 1972 | −36.1% | 1.5 | 1.8 | 3.3 |
| Jan 11, 1973 | Oct 03, 1974 | Jul 17, 1980 | −48.2% | 1.7 | 5.8 | 7.5 |
| Nov 28, 1980 | Aug 12, 1982 | Nov 03, 1982 | −27.1% | 1.7 | 0.2 | 1.9 |
| Aug 25, 1987 | Dec 04, 1987 | Jul 26, 1989 | −33.5% | 0.3 | 1.6 | 1.9 |
| Mar 24, 2000 | Oct 09, 2002 | May 30, 2007 | −49.1% | 2.5 | 4.6 | 7.2 |
| Oct 09, 2007 | Mar 09, 2009 | Mar 28, 2013 | −56.8% | 1.4 | 4.1 | 5.5 |
| Feb 19, 2020 | Mar 23, 2020 | Aug 18, 2020 | −33.9% | 0.1 | 0.4 | 0.5 |
| Jan 03, 2022 | Oct 12, 2022 | Jan 19, 2024 | −25.4% | 0.8 | 1.3 | 2.0 |
The median crash fell 33.7%. Measured from the old peak, the median wait for a new record was 2.1 years. Measured from the bottom, the median climb back took just 1.5 years. Both views matter. The first is what someone who bought at the top went through. The second is what a buyer at the bottom saw, or anyone who kept investing on the way down.
Excluding the Great Depression barely moves the number: for the 11 crashes that started in 1946 or later, the median peak-to-new-high time was 2.0 years, and the median trough-to-old-high time was 1.3 years.
Why depth matters more than anything else
A loss and the gain needed to undo it are not symmetric. That is plain arithmetic, not a market forecast:
| Drop from the high | Gain needed to get back | Example |
|---|---|---|
| −10% | +11% | a typical correction |
| −20% | +25% | bear-market threshold |
| −34% | +52% | 2020 (−33.9%) |
| −50% | +100% | 2000 (−49.1%) |
| −57% | +133% | 2007–09 (−56.8%) |
| −86% | +614% | 1929–32 (−86.2%) |
A 20% drop needs a 25% gain to get back to even. A 57% drop, like 2007–09, needs +133%. The 1929 crash, at −86.2% on daily closes, needed +614%. Because the required gain grows faster than the loss, recovery time grows faster than depth, which is why the scatter chart above uses a log scale. Below about −40%, the S&P 500’s history has been a matter of months to a few years. Past roughly −45%, every recovery took at least 5.5 years.
The speed of the fall matters too. In 2020 the index took 33 calendar days to fall 33.9% (from 3,386.15 on February 19 to 2,237.40 on March 23) and had a new record close of 3,389.78 by August 18. The 2000 crash was shallower than 2007’s at the bottom (−49.1% vs −56.8%) yet took longer overall (7.2 vs 5.5 years), because the decline itself dragged on for 2.5 years.
The animation lines up six post-war crashes on the same clock, with each record high set to 100:
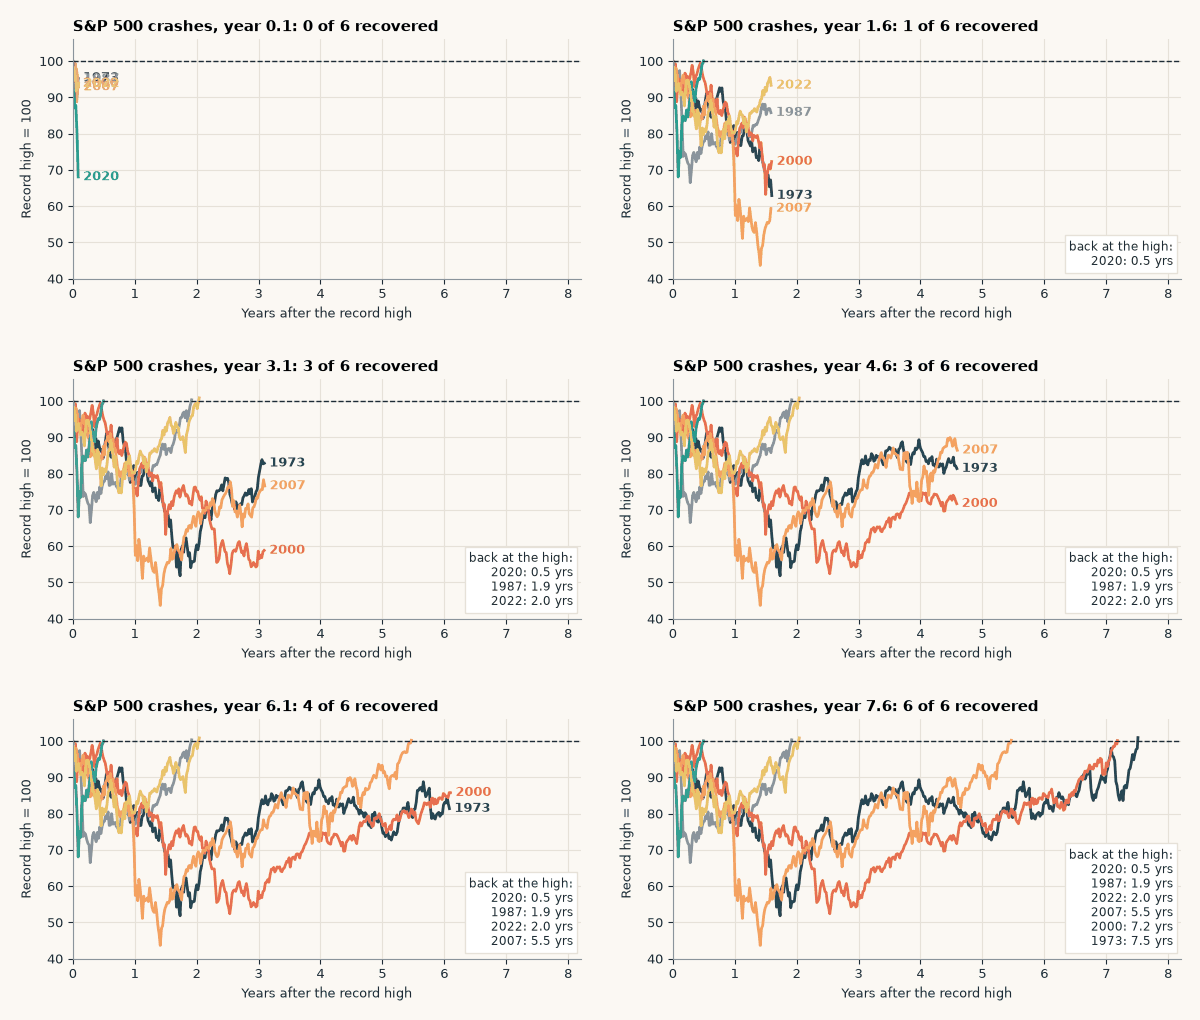
Three of the six had recovered before the three-year mark. The other three needed 5.5 to 7.5 years.
Smaller drops: corrections of 10% to 20%
Most of the scary headlines are about corrections, not crashes. Using the same rules, the S&P 500 had 14 declines of 10% to just under 20% from a record close that never turned into a full crash. The median time from peak to new high was 7 months, and the longest took 1.5 years. That list includes 2025: the index fell 18.9% from its February 19 record to its April 8 low and set a new record on June 27, 2025.
The famous “25 years” is a price-only number
The price index ignores dividends, and dividends do a lot of the work in a recovery. For crashes since 1988 I reran the same test on the S&P 500 Total Return index (^SP500TR, Yahoo Finance). For 1929 I used Robert Shiller’s monthly S&P data, which includes dividends and the CPI (monthly averages, so its dates are a little coarser):
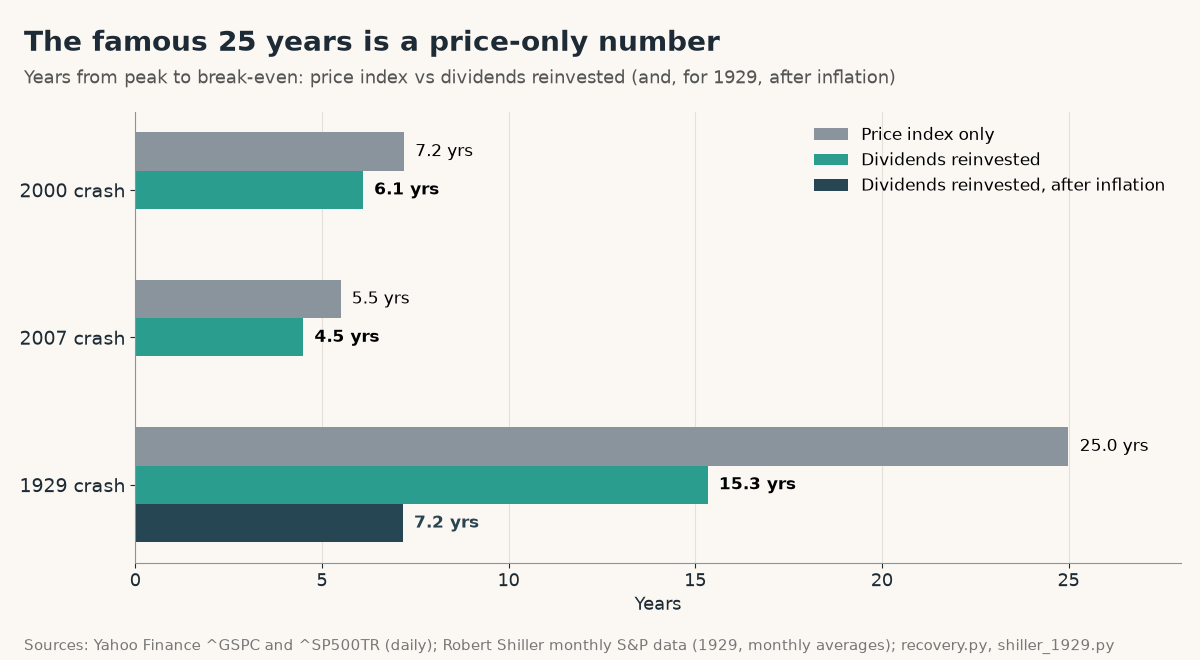
- 2000 crash: 7.2 years on price, 6.1 years with dividends reinvested.
- 2007 crash: 5.5 years on price, 4.5 years with dividends.
- 2020 and 2022: dividends hardly matter over 0.5 to 2 years (0.5 and 1.9 years with dividends).
- 1929 crash: 25.0 years on price (September 1929 to September 1954), 15.3 years with dividends reinvested (January 1945). Adjusted for the 1930s deflation as well, a dividend-reinvesting investor was whole in real terms by November 1936, 7.2 years after the peak.
That doesn’t make 1929 painless. Even with dividends, the real loss at the bottom was about 77%. But “it took 25 years to recover” describes a price chart, not the experience of someone who held the index and reinvested its income.
Rule: when someone quotes a recovery time, ask two questions: measured from the peak or from the bottom, and price or total return? The same 1929 crash is a 25.0-year, 15.3-year or 7.2-year recovery depending on the answer.
The Python script
This script finds every crash, prints the table above, and compares price-only recovery with total-return recovery since 1988. Change the ticker argument to "^IXIC", "QQQ", or any fund you own to run the same test on it. The 1929 dividend check lives in a separate helper (shiller_1929.py) because it reads Shiller’s spreadsheet instead of Yahoo data.
"""How long does it take the stock market to recover from a crash?
Every S&P 500 decline of 20%+ since 1928, measured peak -> trough -> back to the old peak.
Data: Yahoo Finance daily closes (^GSPC price index, ^SP500TR total return) via yfinance.
pip install yfinance pandas"""
import pandas as pd

END = "2026-10-29"   # last full trading day when this was written

def load(ticker="^GSPC"):
    try:
        s = pd.read_pickle(f"src/{ticker.strip('^').lower()}.pkl")["Close"][ticker]
    except FileNotFoundError:
        import yfinance as yf
        s = yf.download(ticker, start="1927-12-01", auto_adjust=False, progress=False)["Close"][ticker]
    return s.loc[:END].dropna()

def crashes(s, threshold=0.20):
    """One row per decline of at least `threshold` from a record close, until a new record."""
    peak = s.cummax(); dd = s / peak - 1
    rows, start = [], None
    for date, d in dd.items():
        if d < 0 and start is None:
            start = date                                  # first close below the old record
        elif d == 0 and start is not None:
            seg = dd.loc[start:date]
            if seg.min() <= -threshold:
                p = s.loc[:start].index[-2]               # the record close itself
                t = seg.idxmin()
                rows.append(dict(peak=p, trough=t, recovered=date, depth=seg.min()))
            start = None
    if start is not None and dd.loc[start:].min() <= -threshold:   # still under water
        seg = dd.loc[start:]
        rows.append(dict(peak=s.loc[:start].index[-2], trough=seg.idxmin(), recovered=pd.NaT, depth=seg.min()))
    df = pd.DataFrame(rows)
    yrs = lambda a, b: (b - a).dt.days / 365.25
    df["down_yrs"] = yrs(df.peak, df.trough)
    df["up_yrs"] = yrs(df.trough, df.recovered)            # trough back to the old peak
    df["total_yrs"] = yrs(df.peak, df.recovered)           # peak to new record
    return df

def recover_date(s, peak, trough):
    """First close at or above the peak level after the trough (None if not yet)."""
    after = s.loc[trough:]
    hit = after[after >= s.loc[peak]]
    return hit.index[0] if len(hit) else pd.NaT

if __name__ == "__main__":
    s = load()
    C = crashes(s)
    print(f"S&P 500 price index, {s.index[0]:%b %d %Y} to {s.index[-1]:%b %d %Y}: {len(C)} declines of 20%+")
    print(f"{'peak':>11} {'trough':>11} {'recovered':>11} {'depth':>7} {'down':>6} {'up':>6} {'total':>6}  (years)")
    for _, r in C.iterrows():
        rec = f"{r.recovered:%Y-%m-%d}" if pd.notna(r.recovered) else "not yet"
        print(f"{r.peak:%Y-%m-%d} {r.trough:%Y-%m-%d} {rec:>11} {r.depth:>7.1%} {r.down_yrs:>6.1f} {r.up_yrs:>6.1f} {r.total_yrs:>6.1f}")
    done = C.dropna(subset=["recovered"])
    post = done[done.peak >= "1946-01-01"]
    print(f"\nMedian peak-to-new-high: all {done.total_yrs.median():.1f} yrs, since 1946 {post.total_yrs.median():.1f} yrs")
    print(f"Median trough-to-old-high: all {done.up_yrs.median():.1f} yrs, since 1946 {post.up_yrs.median():.1f} yrs")
    print(f"Median depth: {done.depth.median():.1%};  current close {s.iloc[-1]:,.2f} ({s.iloc[-1]/s.max()-1:.1%} from record)")
    c = crashes(s, 0.10); c = c[(c.depth > -0.20)].dropna(subset=["recovered"])
    print(f"Corrections of 10-20% from a record: {len(c)}, median {c.total_yrs.median()*12:.0f} months peak to new high, "
          f"longest {c.total_yrs.max():.1f} yrs")
    for d in (0.10, 0.20, 0.34, 0.50, 0.57, 0.86):
        print(f"  a -{d:.0%} fall needs +{1/(1-d)-1:.0%} to get back")
    tr = load("^SP500TR")                                  # dividends reinvested, starts 1988
    print("\nSince 1988, price-only vs dividends reinvested (years from peak to a new high):")
    for _, r in done[done.peak >= "1988-01-04"].iterrows():
        p2 = tr.loc[r.peak - pd.Timedelta(days=10):r.trough].idxmax()
        t2 = tr.loc[p2:r.recovered].idxmin()
        rec2 = recover_date(tr, p2, t2)
        print(f"  {r.peak:%Y} crash: price {r.total_yrs:.1f} yrs, total return {(rec2 - p2).days/365.25:.1f} yrs "
              f"(depth {tr.loc[t2]/tr.loc[p2]-1:.1%})")
Output (data through October 29, 2026):
S&P 500 price index, Dec 30 1927 to Oct 29 2026: 12 declines of 20%+
       peak      trough   recovered   depth   down     up  total  (years)
1929-09-16 1932-06-01  1954-09-22  -86.2%    2.7   22.3   25.0
1956-08-03 1957-10-22  1958-09-24  -21.5%    1.2    0.9    2.1
1961-12-12 1962-06-26  1963-09-03  -28.0%    0.5    1.2    1.7
1966-02-09 1966-10-07  1967-05-04  -22.2%    0.7    0.6    1.2
1968-11-29 1970-05-26  1972-03-06  -36.1%    1.5    1.8    3.3
1973-01-11 1974-10-03  1980-07-17  -48.2%    1.7    5.8    7.5
1980-11-28 1982-08-12  1982-11-03  -27.1%    1.7    0.2    1.9
1987-08-25 1987-12-04  1989-07-26  -33.5%    0.3    1.6    1.9
2000-03-24 2002-10-09  2007-05-30  -49.1%    2.5    4.6    7.2
2007-10-09 2009-03-09  2013-03-28  -56.8%    1.4    4.1    5.5
2020-02-19 2020-03-23  2020-08-18  -33.9%    0.1    0.4    0.5
2022-01-03 2022-10-12  2024-01-19  -25.4%    0.8    1.3    2.0

Median peak-to-new-high: all 2.1 yrs, since 1946 2.0 yrs
Median trough-to-old-high: all 1.5 yrs, since 1946 1.3 yrs
Median depth: -33.7%;  current close 7,720.39 (-1.3% from record)
Corrections of 10-20% from a record: 14, median 7 months peak to new high, longest 1.5 yrs
  a -10% fall needs +11% to get back
  a -20% fall needs +25% to get back
  a -34% fall needs +52% to get back
  a -50% fall needs +100% to get back
  a -57% fall needs +133% to get back
  a -86% fall needs +614% to get back

Since 1988, price-only vs dividends reinvested (years from peak to a new high):
  2000 crash: price 7.2 yrs, total return 6.1 yrs (depth -47.4%)
  2007 crash: price 5.5 yrs, total return 4.5 yrs (depth -55.3%)
  2020 crash: price 0.5 yrs, total return 0.5 yrs (depth -33.8%)
  2022 crash: price 2.0 yrs, total return 1.9 yrs (depth -24.5%)
What this means for your own portfolio
| Situation | What 1928–2026 history says | What to do |
|---|---|---|
| A 10–20% correction | 14 cases, median 7 months to a new high, longest 1.5 years | Usually nothing; rebalance if your bands are hit |
| A 20–40% bear market | 8 cases, 0.5 to 3.3 years to a new high | Keep contributing; don’t sell to cash |
| A 45%+ collapse | 4 cases, 5.5 to 25 years on price | Hold money needed within 5 years outside stocks |
| You reinvest dividends | 2000: 7.2 → 6.1 yrs; 1929: 25.0 → 15.3 yrs | Measure your recovery on total return, not price |
| You hold one stock or sector | Nasdaq Composite: about 15 years after 2000 | Index history doesn’t transfer to concentrated bets |
Three practical takeaways from the data:
- Plan for the median, but survive the tail. Two years is the typical wait. Waits of 5.5 to 7.5 years have happened three times since 1973. Money you need within five years arguably shouldn’t depend on a quick rebound.
- Keep contributing. The trough-to-old-high leg (median 1.5 years) is shorter than the full episode because shares bought near the bottom recover first. Our lump sum vs DCA test looks at what happens to a cash pile that waits on the sidelines instead.
- Rebalancing helps in practice. Selling bonds to buy stocks during a crash shortens your personal recovery. The how often to rebalance backtest shows annual rebalancing was enough. For judging how bumpy a fund’s ride is beyond its drawdown, see Sharpe ratio vs Sortino ratio.
For context on today: the S&P 500 closed at 7,720.39 on October 29, 2026, 1.3% below its record close of 7,818.93 on October 6, 2026. That’s nowhere near crash territory. This is history, not a forecast, and not investment advice.
Limitations
- Only 12 crashes. The median moves if you add or drop one episode, and four of the 12 come from very different eras (pre-war, 1970s inflation, dot-com, 2008).
- Index, not your portfolio. A single stock, a sector fund, or a leveraged ETF can take far longer. The Nasdaq Composite took about 15 years to regain its March 2000 closing peak (April 2015, per Yahoo Finance
^IXIC), and plenty of individual stocks never did. - Nominal for most rows. Apart from the 1929 check, the numbers ignore inflation, and inflation can flip the story. In Shiller’s monthly data the 1973 crash took 7.5 years on price, only 3.5 years with dividends reinvested (July 1976), but 12.0 years with dividends after inflation (January 1985).
- Closing prices. Intraday lows were slightly deeper, and the 20% line is a convention, not a law (1990 and 2018 both stopped just short at −19.9% and −19.8%).
Turn your crash notes into something people read
If you’ve been building this kind of analysis for yourself (drawdown rules, a rebalancing checklist, a crash playbook for a nervous spouse), it is close to being a short finance guide or a lead magnet for a newsletter. ImagineYourBook turns a prompt or your notes into a complete text draft with a cover, exported as Word and EPUB. If you already have a long write-up, its Manuscript Rewrite can reshape it into a shorter edition. The trial is $0 today but requires a card. It includes one 10,000-word Small Book, and the Author plan ($29.99/month) starts after 7 days unless you cancel before day 8. Check every number in the draft against your own script before you publish it.
Sources (checked October 30, 2026): Yahoo Finance: S&P 500 (^GSPC) history · Yahoo Finance: S&P 500 Total Return (^SP500TR) · Yahoo Finance: Nasdaq Composite (^IXIC) · Robert Shiller, U.S. stock market data (ie_data.xls) · yfinance on GitHub · ImagineYourBook pricing and trial terms. Scripts: recovery.py (shown above), shiller_1929.py. Not investment advice.