Problem Formulation and Solution Overview
Aaron, an Icelandic Photographer, has a beautiful picture of their famous Elephant Rock. He needs to convert this picture from an RGB to Grayscale representation and has asked for your assistance.
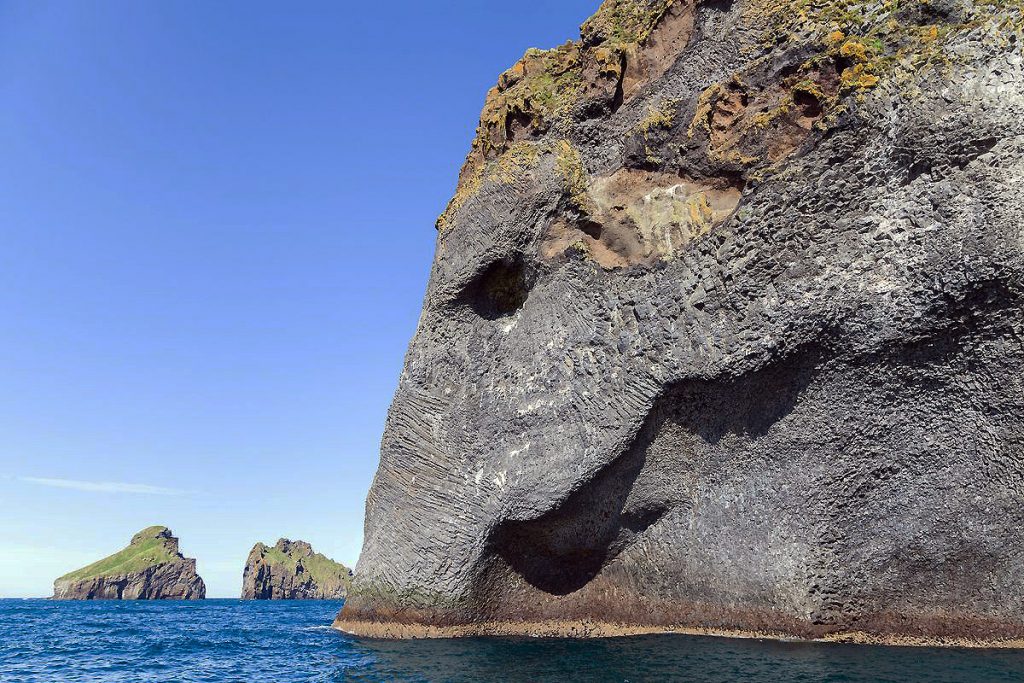
💡Note: To follow along, right-click on the above image and save it as erock_rgb.jpg, then move to the current working directory.
Method 1: Use image.convert()
This method imports the PIL (pillow) library allowing access to the img.convert() function. This function converts an RGB image to a Grayscale representation.
from PIL import Image
img_rgb = Image.open('erock_rgb.jpg')
img_gray = img_rgb.convert('L')
img_gray.save('erock_gray.jpg')
Above, imports the PIL (pillow) library. Click here to install the pillow library, if required.
Next, the image saved earlier is opened (Image.open('erock_rgb.jpg')) and passed the image name as an argument. This returns an object img_rgb similar to below.
<PIL.JpegImagePlugin.JpegImageFile image mode=RGB size=1200x800 at 0x24B4A254550> |
This object allows us access to and manipulation of this particular image. Using img_rgb.convert('L'), converts the RGB object to a Grayscale representation of the same. The results save as erock_gray.jpg.
A compact way to perform the same task is to append convert('L') to the end of the second line: reducing the code by one (1) full line.
from PIL import Image
img_rgb = Image.open('erock_rgb.jpg').convert('L')
img_rgb.save('erock_gray.jpg')
Method 2: Use imread()
This method imports the OpenCV library to call in and use various functions to convert an RGB image to a Grayscale representation.
import cv2

img_rgb = cv2.imread('erock_rgb.jpg')
img_gray = cv2.cvtColor(img_rgb, cv2.COLOR_BGR2GRAY)

cv2.imshow('Original image',img_rgb)
cv2.imshow('Gray image', img_gray)

cv2.waitKey(0)
cv2.destroyAllWindows()
Above, imports the OpenCV library.
Next, erock_rgb.jpg is read in using cv2.imread('erock_rgb.jpg'). The results saves to img_rgb.
If img_rgb was sent to the terminal, the following would display as follows (snippet only):
[[[218 130 90] |
Then, the following line converts the above image to Grayscale (cv2.cvtColor(img_rgb, cv2.COLOR_BGR2GRAY)) and saves to img_gray.
If img_gray
[[128 128 129 … 132 100 182] |
💡Note: Notice the RGB color changes when img_rgb is output to the terminal compared to img_gray.
Finally, image.show() is called twice. Once to display the original RGB image (underneath), and once to display the Grayscale representation (top).
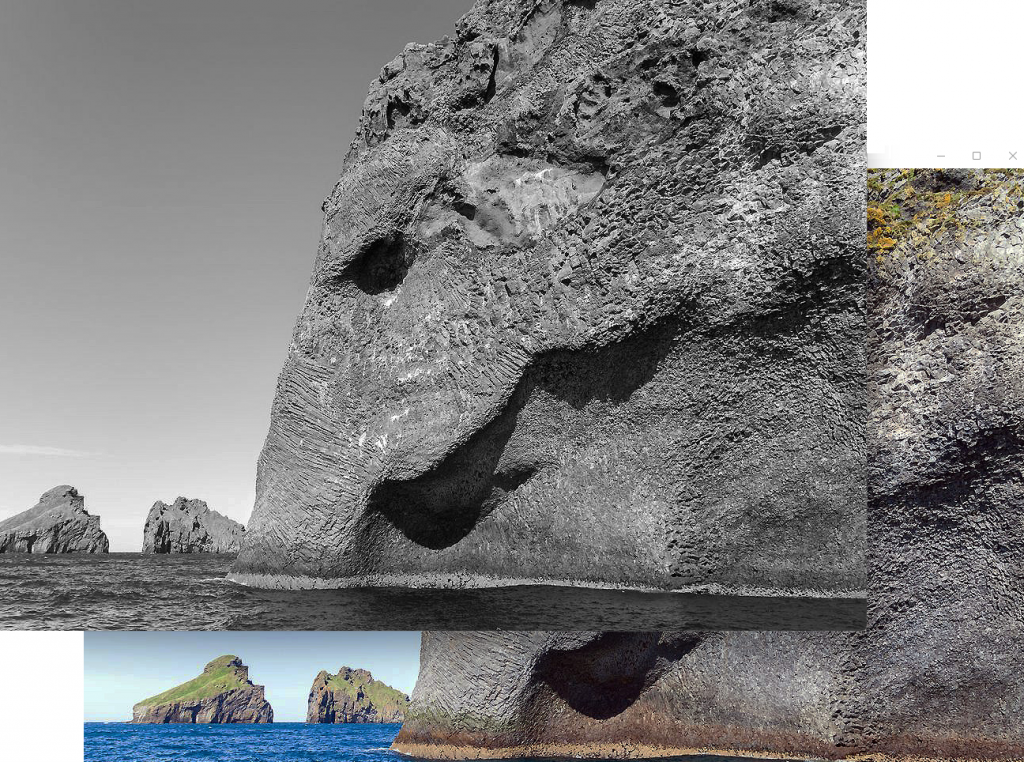
These images continue to display until a key is pressed. Once this occurs, the images disappear and are destroyed.
Method 3: Use NumPy
This method uses both the NumPy and Matplotlib libraries to read an RGB image, convert it to a Grayscale representation, plot, and display the image on a graph.
import numpy as np
import matplotlib.pyplot as plt
import matplotlib.image as mpimg

def rgb2gray(rgb):
    return np.dot(rgb[...,:3], [0.299, 0.587, 0.144])

img_rgb = mpimg.imread('erock_rgb.jpg')
img_gray = rgb2gray(img_rgb)

plt.imshow(img_gray, cmap=plt.get_cmap('gray'))
plt.savefig('erock_gray.jpg')
plt.show()
Above, two (2) libraries and called in: NumPy to use the np.dot() function and Matplotlib to handle the other calls.
Next, a function is created accepting an object as an argument. This function, when called later converts the argument passed (img_rgb) into a Grayscale representation and returns the same.
If img_gray
[[134.612 134.612 135.642 … 135.339 102.933 187.105] |
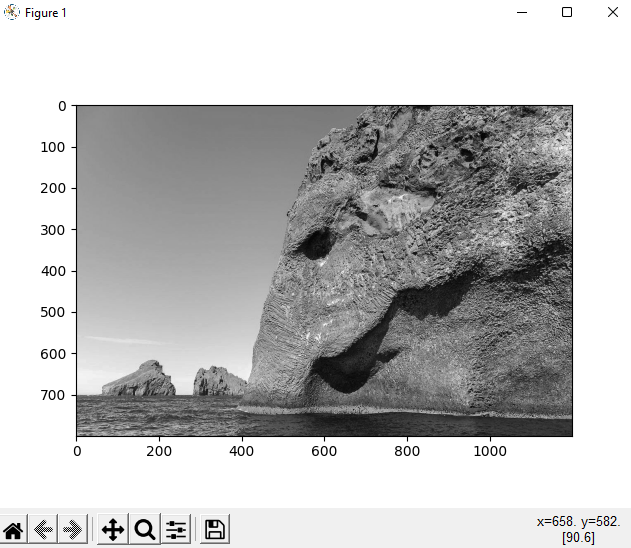
Then, the Grayscale representation is plotted as a graph and output as shown below:
Method 4: Use Matplotlib and Sci-Kit-Learn
This method imports the Matplotlib and Scikit-Learn libraries to convert an RGB image to a Grayscale Representation. This code displays both the RGB and Grayscale images side-by-side on a graph.
import matplotlib.pyplot as plt
from skimage import io
from skimage import data
from skimage.color import rgb2gray
from skimage import data
rgb_img = io.imread('erock_rgb.jpg')
gray_img = rgb2gray(rgb_img)
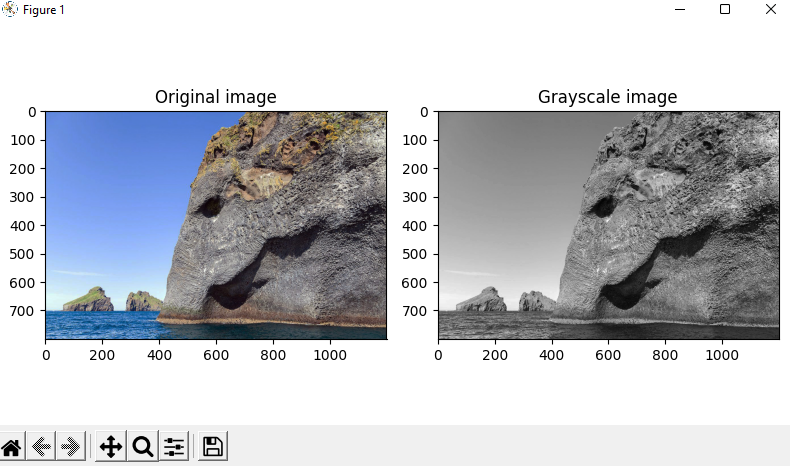
fig, axes = plt.subplots(1, 2, figsize=(8, 4))
ax = axes.ravel()
ax[0].imshow(orig_img)
ax[0].set_title("Original image")
ax[1].imshow(gray_img, cmap=plt.cm.gray)
ax[1].set_title("Grayscale image")
fig.tight_layout()
plt.show()The first five (5) lines import the required libraries and functions therein to successfully execute the code below.
Next, the erock_rgb.jpg file is read in and saved as an object to rgb_img. Then, this object is passed to rgb2gray(), converted and saved to gray_img as a Grayscale representation.
The remaining sections plot the two (2) images on a graph, adding a title to each image respectively and displaying them.
💡Note: Displaying the plot as tight means display compactly.
Summary
Programming Humor – Python