
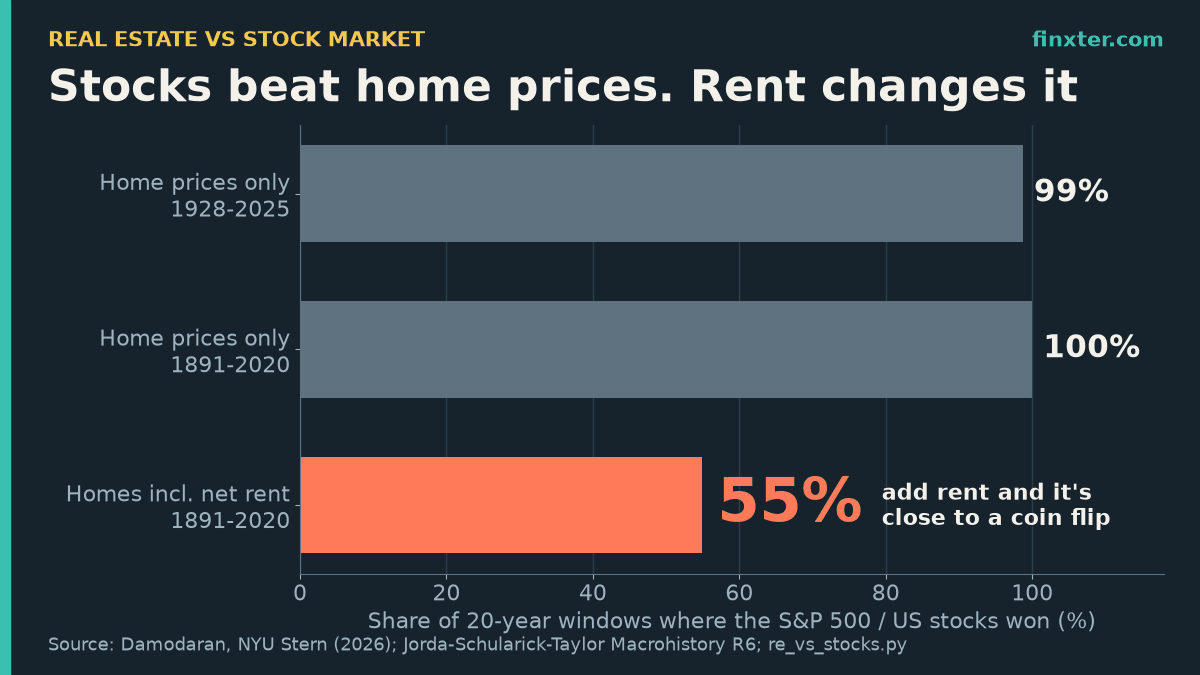
Most “real estate vs stock market” charts compare the S&P 500 with dividends against home prices without rent. That’s like scoring a landlord on the house and ignoring the rent checks. I ran both versions on two public datasets: Aswath Damodaran’s S&P 500 and home-price series (1928 to 2025) and the Jordà-Schularick-Taylor Macrohistory Database, which tracks US housing returns including net rent (1891 to 2020).
Price-only, stocks win almost every 20-year window. Count rent and the race is close: stocks win 61 of 111 windows, and housing does it with less than half the volatility.
A side note before the numbers: whichever asset you pick, the amount you invest each month matters as much as the asset. If you want to raise that number with a side income, one route is a small catalog of self-published ebooks on Amazon KDP. ImagineYourBook is an AI book-writing tool that turns a prompt or your notes into a complete 10,000-word text draft with a cover, exported as Word and EPUB, with series memory for Book Two. The royalty math is in the closing section.
TL;DR
- Price-only, the S&P 500 beat US home prices in 78 of 79 20-year windows (1928-2025): 10.02% vs 4.20% a year.
- Add net rent (JST data, 1891-2020) and stocks win only 61 of 111 windows (55%): 9.50% vs 8.63% a year.
- Housing with rent had less than half the volatility (8.25% vs 18.12%) and a worst real drawdown of -25.04% vs -51.88%.
- Housing won 5 of 12 decades, all with high inflation or a stock crash (1970s: +6.54% real vs -0.90%).
- Holding period matters: stocks won 60% of 10-year and 81% of 30-year windows. Python script included.
Real estate vs stock market returns: the headline numbers
Here are both datasets side by side. “Home prices only” is what most articles quote. “Housing incl. net rent” adds the rental yield after running costs, which is how JST measure a housing total return.
| S&P 500 1928-2025 | Home prices only 1928-2025 | US stocks 1891-2020 | Home prices only 1891-2020 | Housing incl. net rent 1891-2020 | |
|---|---|---|---|---|---|
| Return per year | 10.02% | 4.20% | 9.50% | 3.32% | 8.63% |
| Return after inflation | 6.77% | 1.12% | 6.78% | 0.76% | 5.94% |
| $10,000 grew to | $115,700,909 | $562,602 | $1,330,847,194 | $701,888 | $473,796,416 |
| Volatility (st. dev.) | 19.40% | 6.18% | 18.12% | 8.10% | 8.25% |
| Down years | 26 | 15 | 31 | 28 | 15 |
| Worst real drawdown | -54.83% | -34.57% | -51.88% | -43.50% | -25.04% |
- Price-only housing barely beats inflation: 4.20% a year from 1928 to 2025, just 1.12% real. $10,000 became $562,602 vs $115,700,909 in the S&P 500.
- Rent is most of the housing return: 3.32% price-only vs 8.63% with net rent in the JST data, close to stocks at 9.50%.
- Housing’s risk is much lower: 8.25% volatility vs 18.12%, and a worst real drawdown of -25.04% vs -51.88%.
The comparison trap: the S&P 500 figure almost always includes dividends, the home figure almost never includes rent. Price-only housing returned 3.32% a year in the JST data; with net rent, 8.63%. Check which one an article uses before trusting its verdict.
Damodaran’s own notes say his real estate return “is just price appreciation, and will understate the returns on real estate by the cash flow return (from rental income) each year.” Many top-ranking comparisons still use it as the verdict.
Every 20-year window: real estate vs stock market with rent
A 130-year average hides the timing, so I computed every 20-year window from 1891-1910 to 2001-2020: 111 windows.
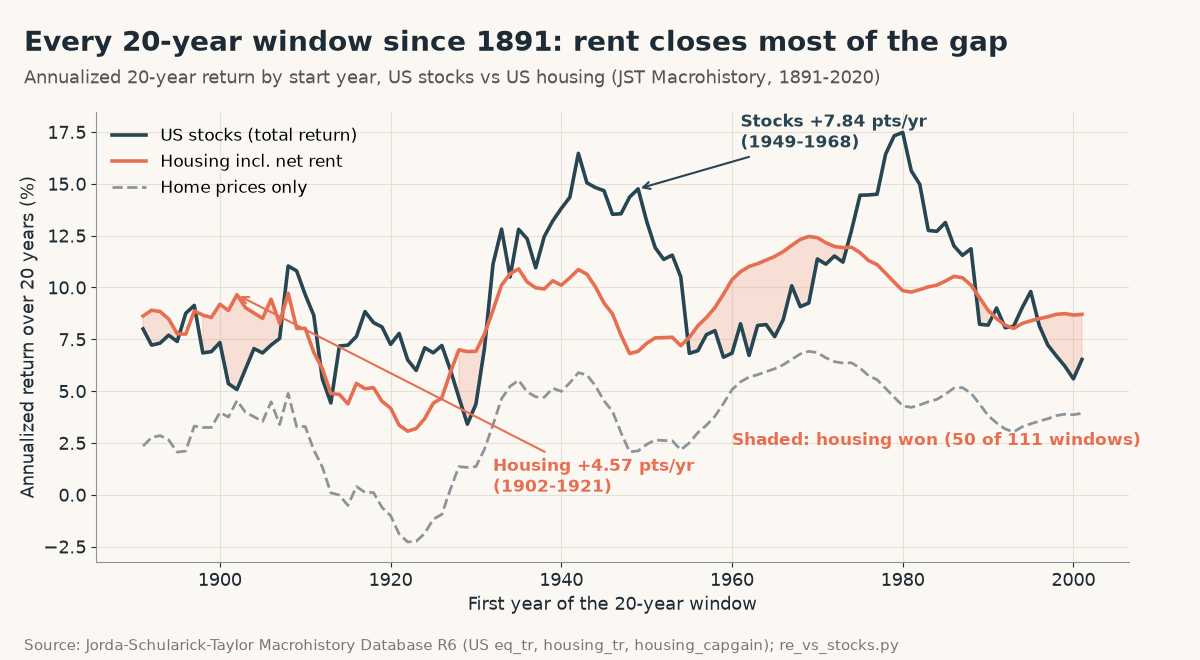
- Price-only: stocks won 111 of 111 windows in the JST data and 78 of 79 in Damodaran’s data. The one exception, 1929 to 1948, went to housing by only 0.87 points a year.
- With net rent: stocks won 61 of 111 (55%). The median gap was just +0.81 points a year in favor of stocks.
- Longest leads: housing beat stocks by 4.57 points a year from 1902 to 1921; stocks beat housing by 7.84 points a year from 1949 to 1968.
The holding period matters. Over 10-year windows stocks won 72 of 121 (60%), and over 30-year windows 82 of 101 (81%). Even at 30 years, housing with rent won about 1 window in 5.
Decade by decade: when housing won
Here are the real (after-inflation) returns per decade from the JST data:
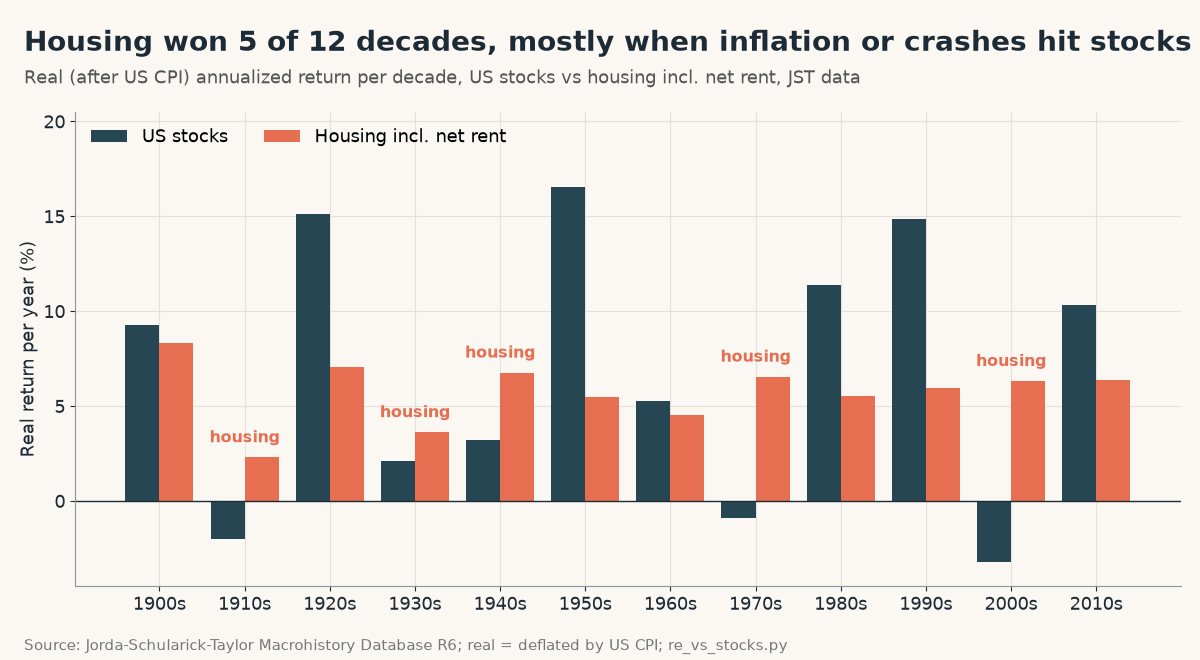
Housing with rent won 5 of 12 decades: the 1910s, 1930s, 1940s, 1970s and 2000s. Each had high inflation or a stock market crash. Stocks won the 1950s (16.55% real a year vs 5.47%), the 1980s and the 1990s by wide margins. In the 1970s, stocks lost 0.90% a year after inflation while housing earned 6.54%. In the 2000s, stocks lost 3.20% a year after inflation while housing earned 6.31%.
The two assets also didn’t move together: the correlation of annual returns was only 0.21 between US stocks and housing with rent (0.15 between the S&P 500 and price-only homes in Damodaran’s data). That’s the diversification case for owning both, the same logic as stocks and bonds.
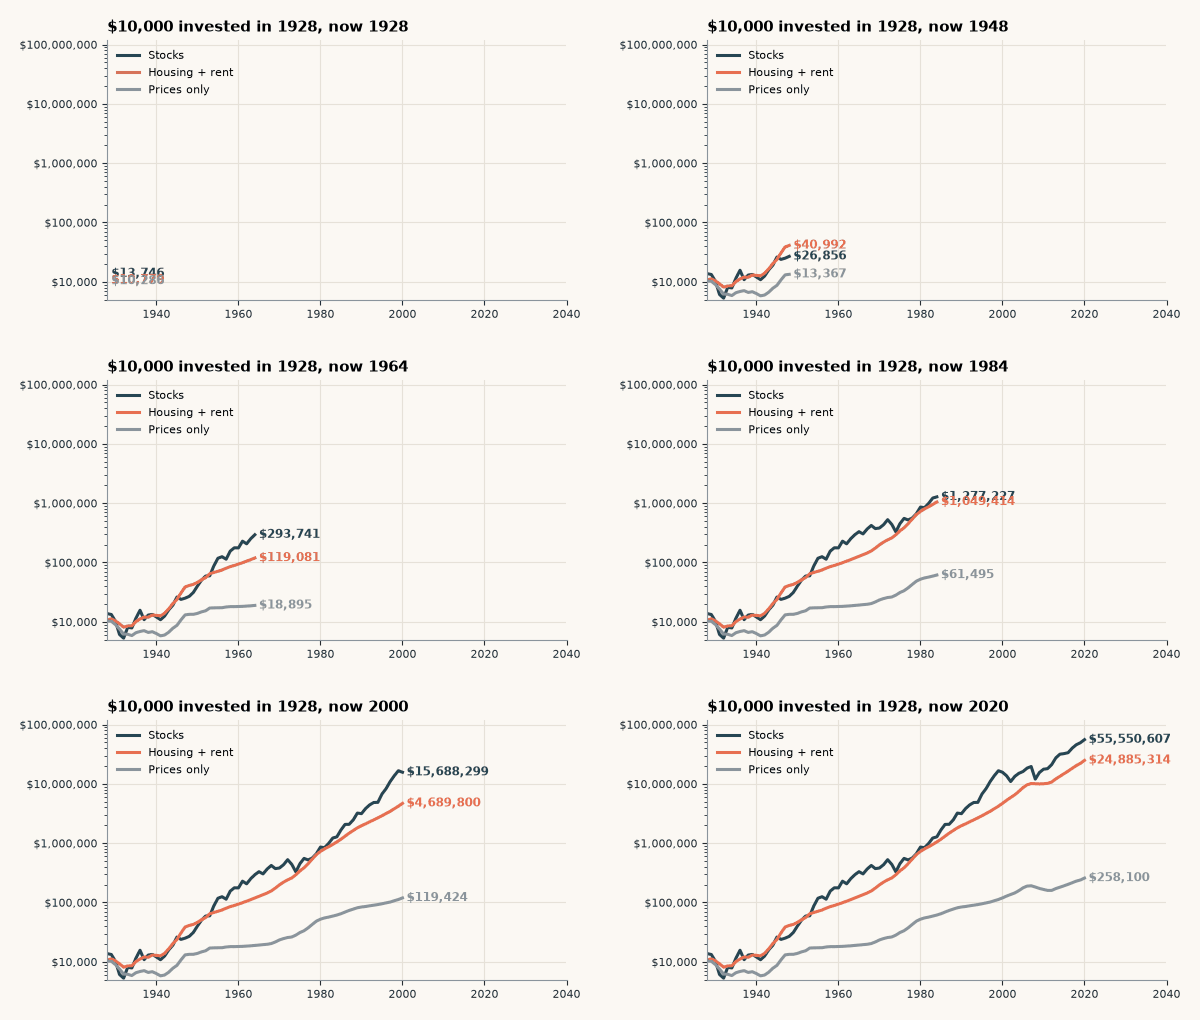
What $10,000 did from 1928 to 2020
Compounding turns small gaps into big balances. Over the same 93 years, the 0.94-point gap (9.71% vs 8.77%) became a 2.2x difference in ending wealth. Price-only, the gap is more than 200x.
What these numbers leave out
The JST housing series is a national index, unlevered, with rent net of running costs and depreciation as the researchers estimate them. A real landlord’s result can differ a lot from that line:
| Factor | In the JST housing line? | What it means for you |
|---|---|---|
| Maintenance, management, insurance, depreciation | Yes, subtracted from rent (estimated) | Your actual costs may be higher or lower |
| Mortgage leverage and interest | No (unlevered) | Leverage magnifies gains and losses; interest is a cost |
| Buying and selling costs | No | Hurts most on short holding periods |
| Taxes | No (stocks are pre-tax too) | Depends on your country and account type |
| One property vs a national index | Index of the whole US market | A single home can land far from the average |
| Your time as a landlord | Not priced | An index fund needs almost none |
If you want a quick look at the owner-occupier side, Finxter’s buy vs rent calculator runs that comparison for your own numbers.
Run the real estate vs stock market test yourself in Python
This script downloads the JST database and reproduces the core result. It needs pandas, requests and openpyxl. If you are new to DataFrames, start with the Finxter pandas quickstart.
import io, requests, pandas as pd

URL = "https://www.macrohistory.net/app/download/9834512569/JSTdatasetR6.xlsx"
raw = requests.get(URL, headers={"User-Agent": "Mozilla/5.0"}).content
us = pd.read_excel(io.BytesIO(raw)).query("iso == 'USA'").set_index("year")
d = pd.DataFrame({"stocks": us.eq_tr, "price_only": us.housing_capgain,
                  "with_rent": us.housing_tr}).dropna().loc[1891:2020]

def cagr(r):
    return (1 + r).prod() ** (1 / len(r)) - 1

for col in d:
    print(f"{col:10s} CAGR {cagr(d[col]):.2%}  stdev {d[col].std():.2%}")

n = 20  # holding period in years
roll = pd.DataFrame({c: [cagr(d[c].iloc[i:i + n]) for i in range(len(d) - n + 1)]
                     for c in d}, index=d.index[:len(d) - n + 1])
for house in ("price_only", "with_rent"):
    wins = (roll.stocks > roll[house]).sum()
    print(f"Stocks beat housing ({house}) in {wins} of {len(roll)} {n}-year windows")
Output:
stocks     CAGR 9.50%  stdev 18.12%
price_only CAGR 3.32%  stdev 8.10%
with_rent  CAGR 8.63%  stdev 8.25%
Stocks beat housing (price_only) in 111 of 111 20-year windows
Stocks beat housing (with_rent) in 61 of 111 20-year windows
Change n = 20 to 10 or 30 for the other holding periods. To compare your own holdings against the index instead of an asset class, see compare my portfolio to the S&P 500, or track it in PortfolioTracker24, a free tracker that runs in your browser with no account, keeps your data local and backs it up to Excel.
So which is better, real estate or the stock market?
Based on this data:
- If “real estate” means a home price index, stocks win. 99% to 100% of 20-year windows, by about 6 points a year at the median.
- If it means a rented property you hold for 20 years, it’s close to a coin flip on return (stocks 55%), and housing wins on volatility and drawdowns. Your costs, leverage and tenant risk decide the outcome, not the asset class.
- If you want hands-off growth, stocks earned more over long windows (81% of 30-year windows) with no landlord work. For what one-time timing does to an index investor, see S&P 500 rolling 10-year returns.
FAQ
Has real estate or the stock market performed better historically?
Stocks, but by less than most charts suggest. From 1891 to 2020, US stocks returned 9.50% a year and US housing with net rent 8.63% (JST data). Home prices alone returned only 3.32%.
Does real estate beat stocks if you include rent?
Sometimes. With net rent, housing beat stocks in 50 of 111 rolling 20-year windows since 1891, including 1902 to 1921 by 4.57 points a year. Stocks won the other 61.
Is real estate less risky than the stock market?
At the national index level, yes. Housing with rent had 8.25% annual volatility vs 18.12% for stocks, and a worst real drawdown of -25.04% vs -51.88%. A single leveraged property is riskier than the index.
Why do most articles say stocks crush real estate?
They compare S&P 500 total returns (with dividends) to home price indexes (without rent). Damodaran's own notes say his home series is price appreciation only and understates real estate returns.
When did real estate beat the stock market?
In the JST data, housing with rent won the 1910s, 1930s, 1940s, 1970s and 2000s. In the 2000s stocks lost 3.20% a year after inflation while housing earned 6.31%.
Bottom line: real estate vs stock market
Price-only comparisons make the stock market look unbeatable; total-return data shows a much closer race, with housing trading some return for a much smoother ride. Pick by the work, leverage and concentration you’ll accept, then focus on what you control: how much you invest each month.
Here’s the napkin math for that lever. Amazon KDP’s 70% royalty option pays 70% of the list price minus delivery costs, which Amazon says average $0.06 per unit. At $4.99, that’s about $3.43 per sale. Assumption, not a typical result: if a few books together sold 30 copies a month, that’s about $103 a month. Invest $100 of it every month for 20 years at the 130-year stock return of 9.50% and you’d have about $67,733; at housing’s 8.63%, about $61,225, on $24,000 paid in. Sales aren’t guaranteed and many books sell far less. To check your own royalty numbers, use the KDP royalty calculator.
If you want to try that route, ImagineYourBook turns an idea or your notes into a full text draft with a cover, ready to edit and publish on KDP. The 7-day trial is $0 with a card and includes one 10,000-word book; if you don’t cancel before day 8, the first charge is $24.99 a month. You still do the editing, the fact check and the marketing.
Sources (checked November 18, 2026): Jordà-Schularick-Taylor Macrohistory Database, Release 6 (JSTdatasetR6.xlsx) · Jordà, Knoll, Kuvshinov, Schularick, Taylor: The Rate of Return on Everything, 1870-2015 (NBER w24112) · Aswath Damodaran (NYU Stern): Historical returns, 1928-2025 · histretSP.xls (S&P 500, real estate, inflation) · Amazon KDP: eBook Royalties · ImagineYourBook pricing and trial terms · PortfolioTracker24. Scripts: re_vs_stocks.py (full analysis) and the short version shown above. Past returns don’t predict future returns. Not investment advice.